Dataviz poster detail
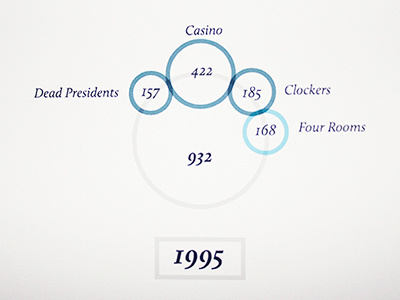
Bubble chart detail from a dataviz poster done a while ago. The visualisation shows how many times the ‘f-word’ has been mentioned in films, by year. Each year is displayed in series (small multiple) from higher to lower use of the word.
See the full project here > http://www.tizianaalocci.com/