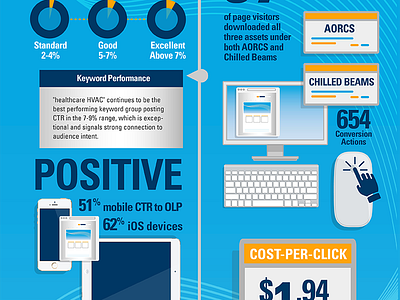
Titus Infographic: Analytics Visualized —"Steaks-n-Lobster"
Please review the attachment because it shows the entire infographic. The project objectives: visualize Google analytics. Iconography and graphics created in Adobe Illustrator.
More by Tim Tourtillotte View profile
Like

