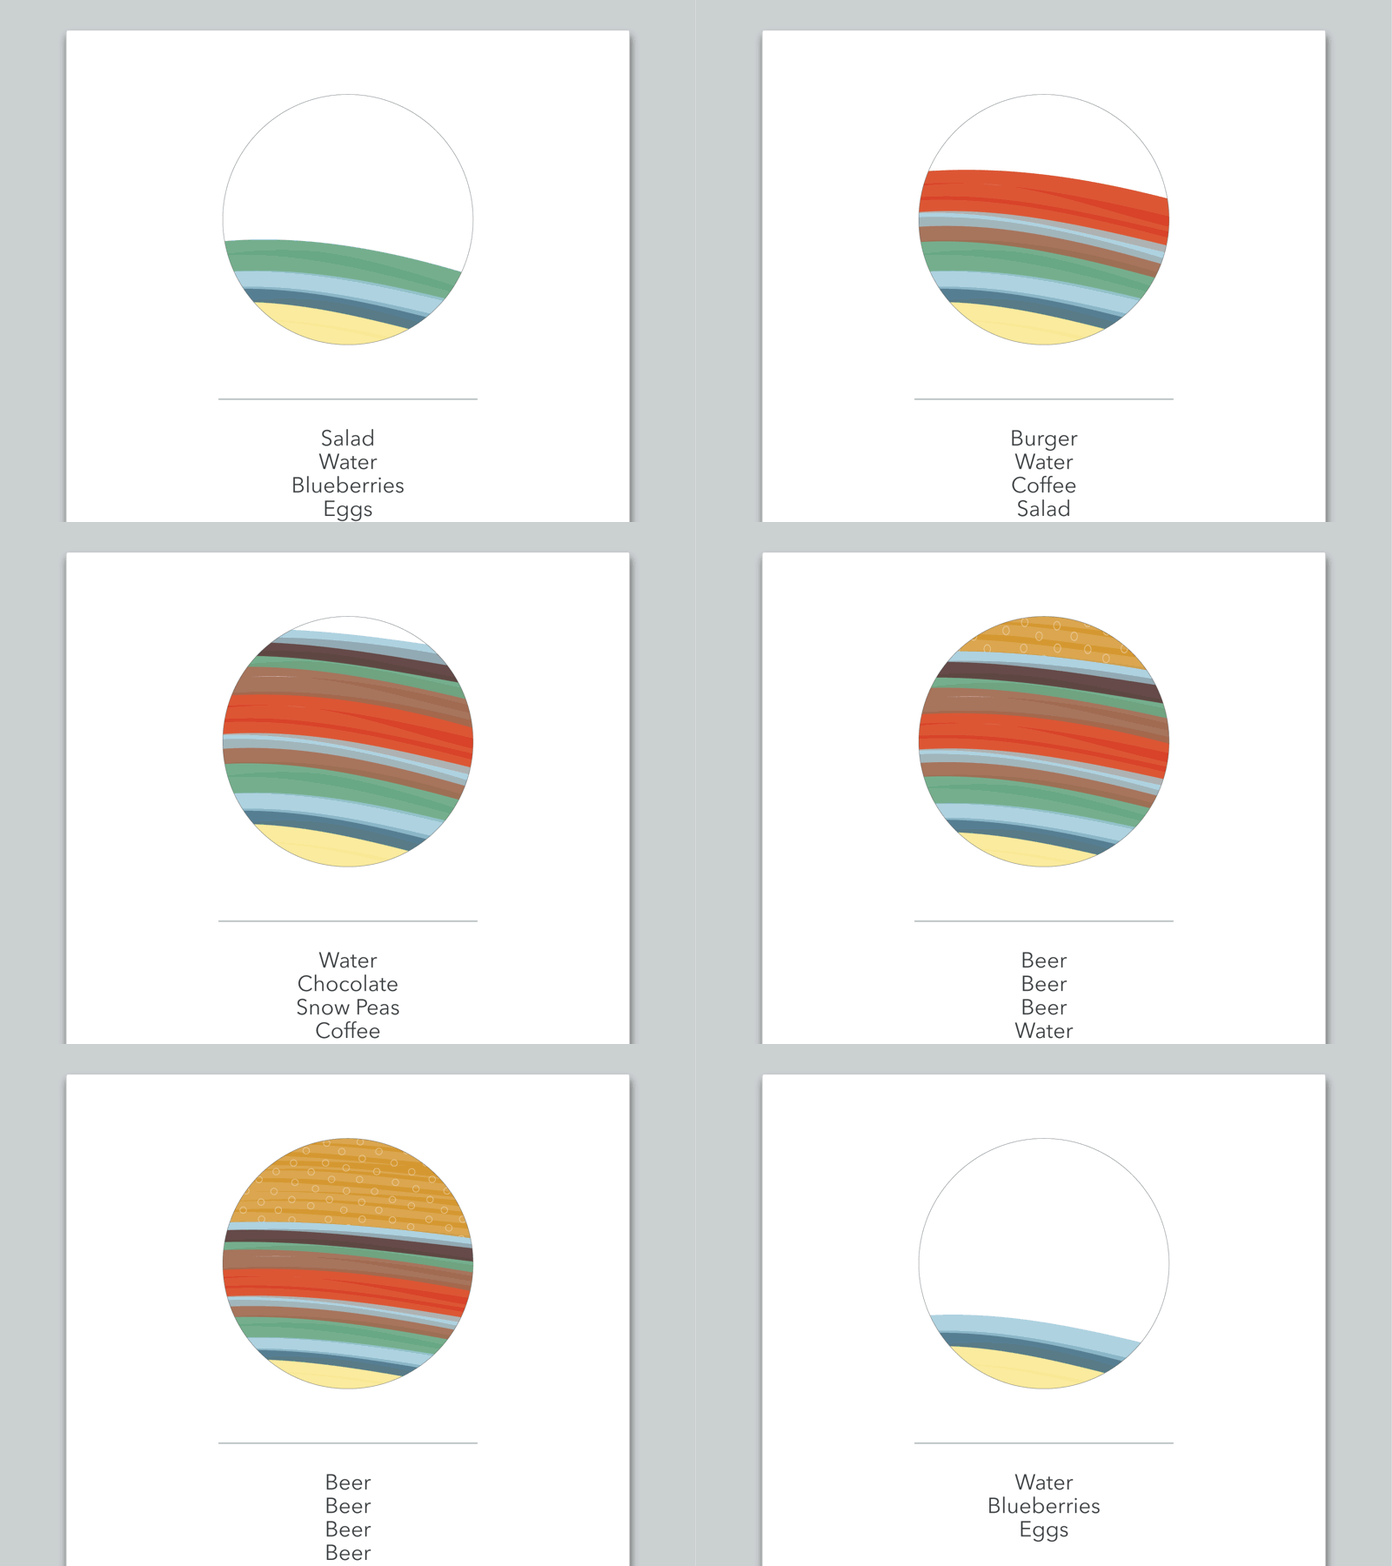
Fruit Stripes - Food Tracking Data Viz Concept
Visualization highlighting the different types of food a user eats throughout a day. The colors and textures of each stripe represent a broad type of food. The height of each stripe represents the number of calories (roughly). The circle represents the person's target number of recommended calories for the day.
So, as the user tracks a food item, it's represented visually as a stacked stripe, up to the # of recommended calories. If they exceed the # of recommended calories, the stripes start to condense, vaguely representing packing food into a "full" stomach.
More by Eli Holder View profile
Like
