InfoVis – impact of growing cities
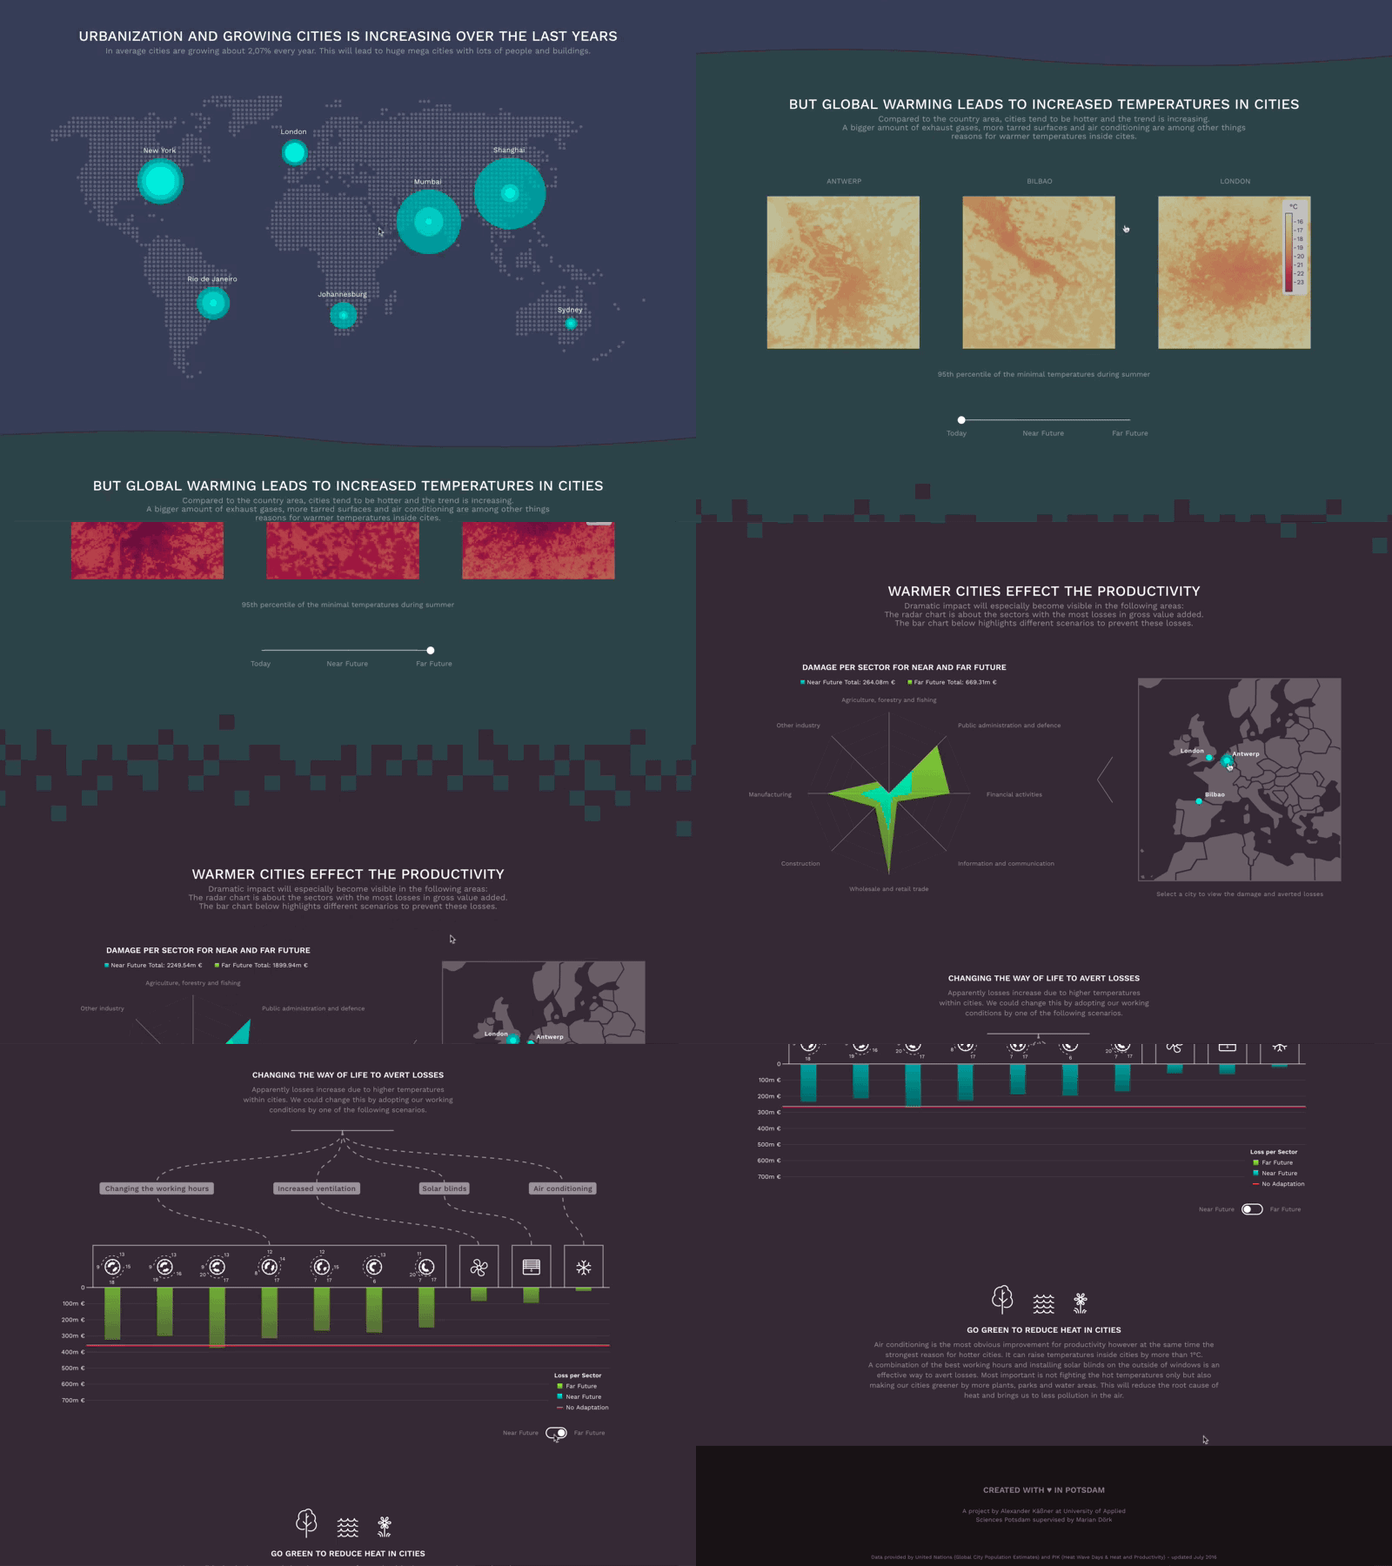
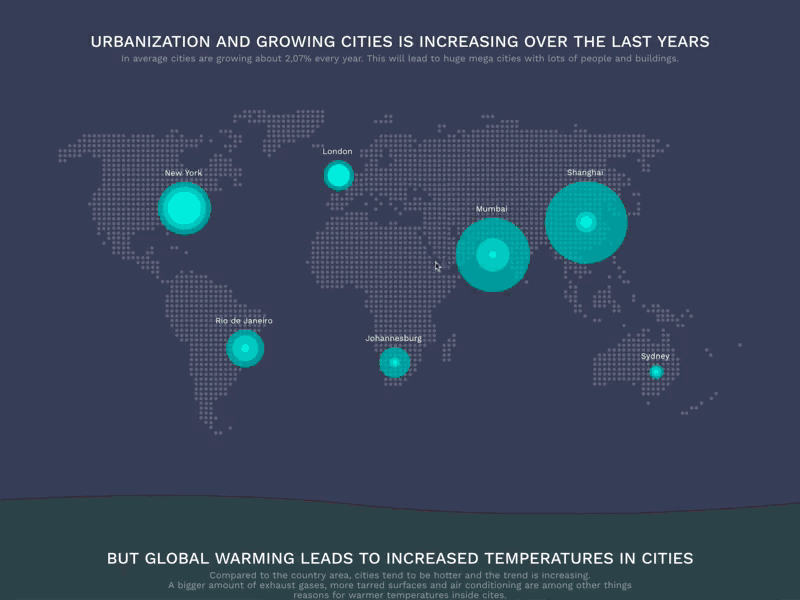
This is my second information visualization project I've made at my university. It's about growing cities and the impact of heat to the productivity. This project is an interactive website made with d3.js
Data provided by United Nations (Global City Population Estimates) and PIK (Heat Wave Days & Heat and Productivity).
More by Alexander Käßner View profile
Like


