Port stats
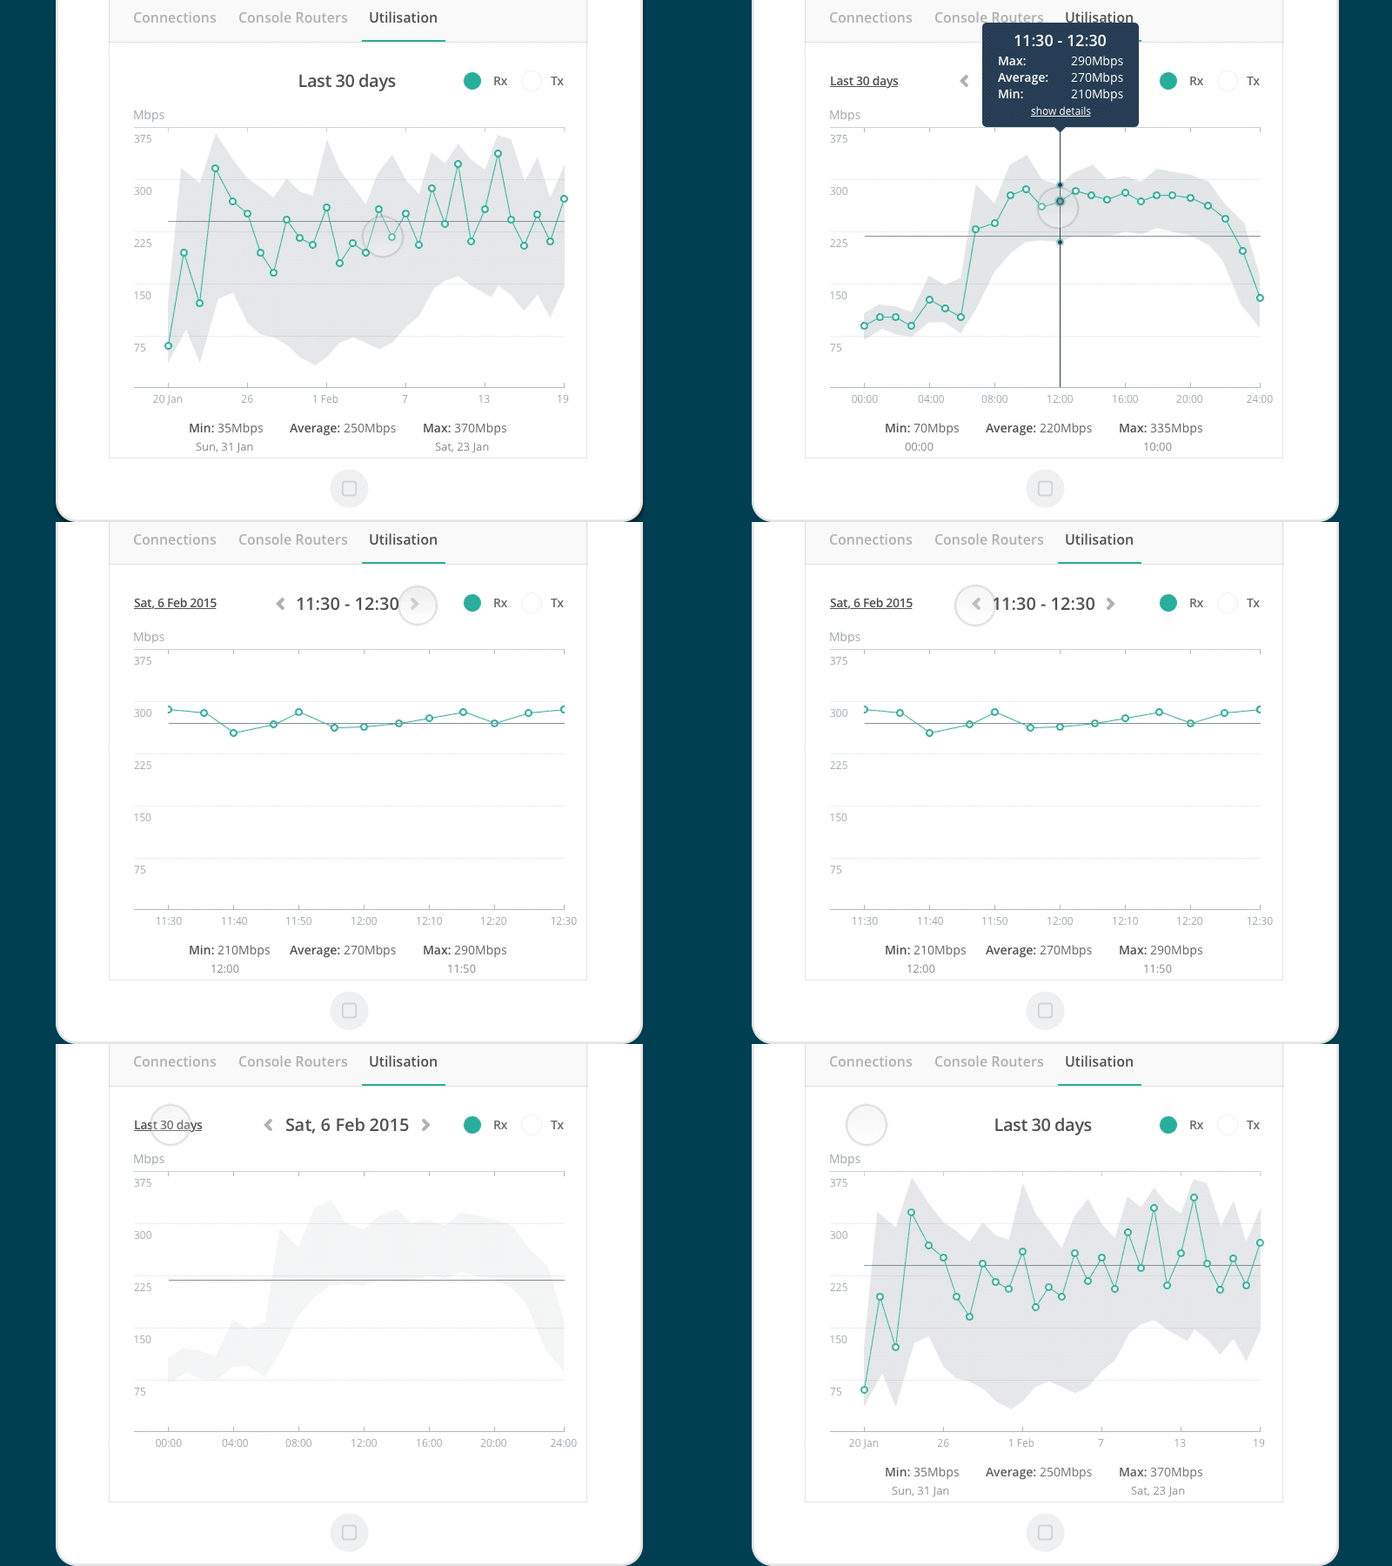
A little prototype to explore drilling down, across and back up.
Port utilisation is sampled every 5 mins. We show averages for aggregated periods plus the min and max for that period. For example in the 30 day view, each data point on the green series represents the average for a single day and the grey area behind indicates the min and max sample for the day.
More by Console Connect by PCCW Global View profile
Like
