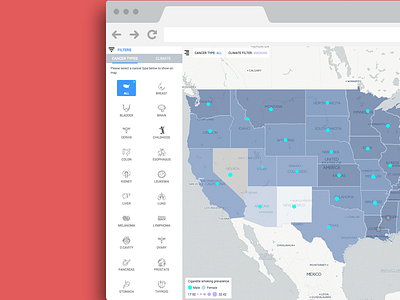
Full app view and filters
Climate and cancer map filters are shown on left panel that user can select various cancer types to create thematical analysis (based on a million incidents that occured in u.s during certain years) and lists state cancer profile characteristics based on the climate filters .User can create dot analysis to see prevalance and pulsing points are indicating cancer level and climate levels are at the top risky point.
More by cagatay celebioglu View profile
Like


