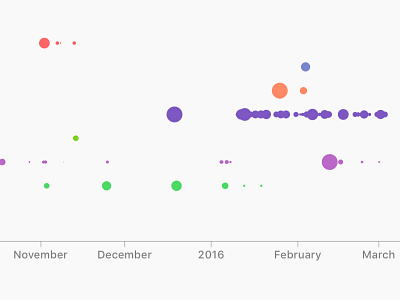
Time Reports
Visualizing raw data has got to be the favorite part of my job. And javascript libs like D3 make this a whole lot easier for me.
This is the Reporting section of Zypher for your timers. You can visualize them over a span of time to identify areas of downtime, slow movement through the project's timeline and so on (How you infer it, is actually entirely up to you ;) )
Check out the attached screen for the full view. This is an actual screenshot from the web app itself (and not a mockup).
The problem that I face now, is that given how small some dots could be, hovering on them to reveal tooltips is nearly impossible unless you zoom-in (anti-pattern?). Yet to figure that one out. Until then.
More by Dezine Zync Studios View profile
Like

