FIT Phase Diagram and Force Velocity Curve
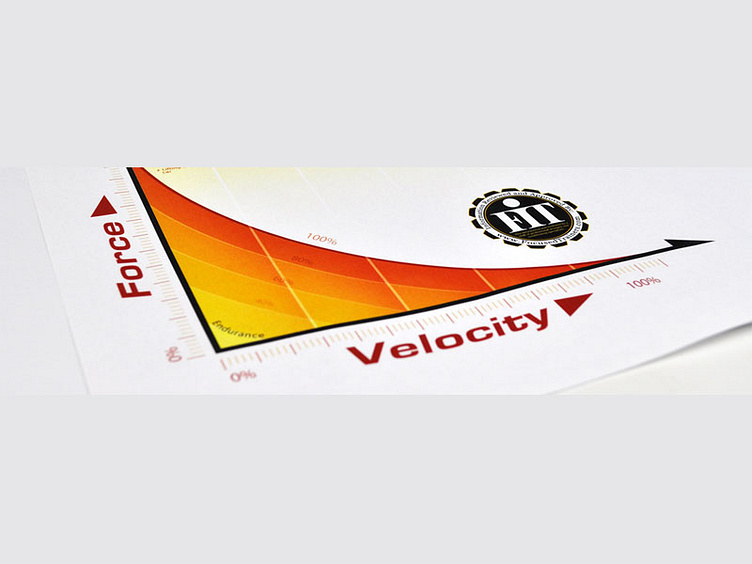
F.I.T. believes in and uses the training concepts of phased training and the force-velocity curve. The challenge presented to Go Media was to create a visual representation that was both scientifically accurate, descriptive and visually appealing.
We started by researching other diagrams used to explain these concepts. We took the best of what we found and vetted it against F.I.T.’s particular training philosophies. Next we established a color code to represent effort. Red equaled maximum effort, yellow was minimum effort. Overlapping gradients were used to create the look of a smooth transition combined with segmenting the phases. These diagrams became the backbone of F.I.T.’s marketing materials. Used on both print and web marketing materials, they communicated the sophistication of F.I.T.’s approach to training and physical fitness.