Financial Accounting Service Interface for Toy Store “Toyland”
Overview
This project focuses on developing an intuitive, modern, and aesthetically pleasing interface for the financial accounting service of a toy store, Toyland. The design aims to simplify the control of expenses, income, budgets, and other financial operations, enhancing efficiency and accuracy for financial managers, accountants, and company executives.
Goal
Create a user-friendly interface that integrates AI-powered analytics, detailed financial overviews, and budget planning tools to streamline financial management processes.
Target Audience
Primary: Financial managers, accountants, and company executives.
Secondary: Middle managers needing access to financial reports.
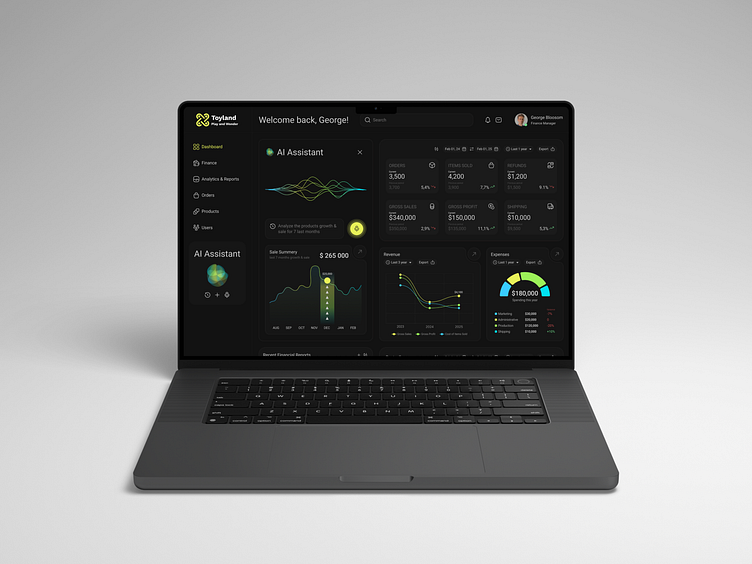
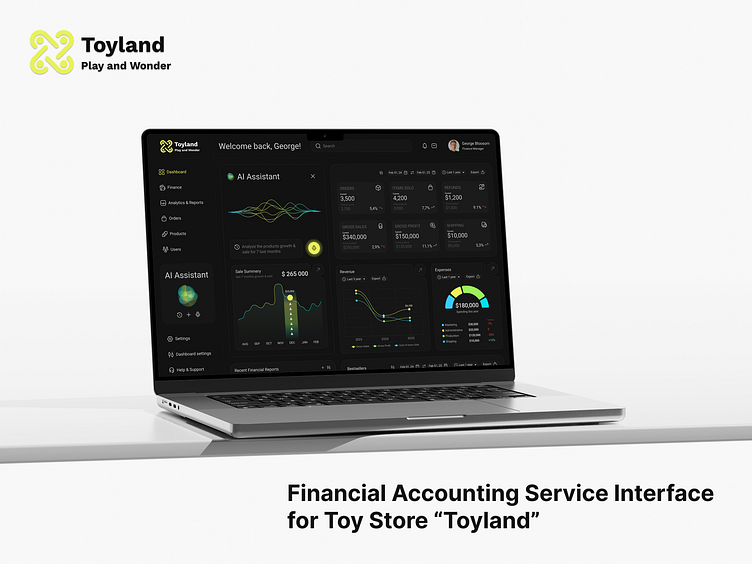
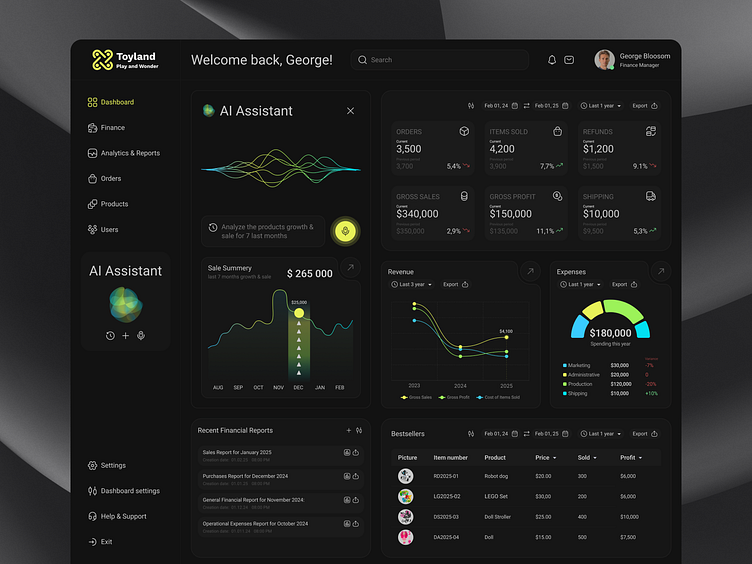
Dashboard
Personalized Welcome Message: Creates a friendly user experience.
Search Bar: Ensures quick navigation and access to various functions.
User Information: Displays user role and profile, aiding in identification and communication.
AI Assistant: Analyzes product growth and sales using advanced data analytics.
Sales Graph: Visualizes sales data over a period, highlighting key trends.
Recent Financial Reports: Provides quick access to the latest reports.
Key Financial Metrics: Displays essential financial indicators, offering an at-a-glance overview of the company’s financial health.
Income and Expense Graphs: Visualize income trends and expense distribution for comprehensive financial analysis.
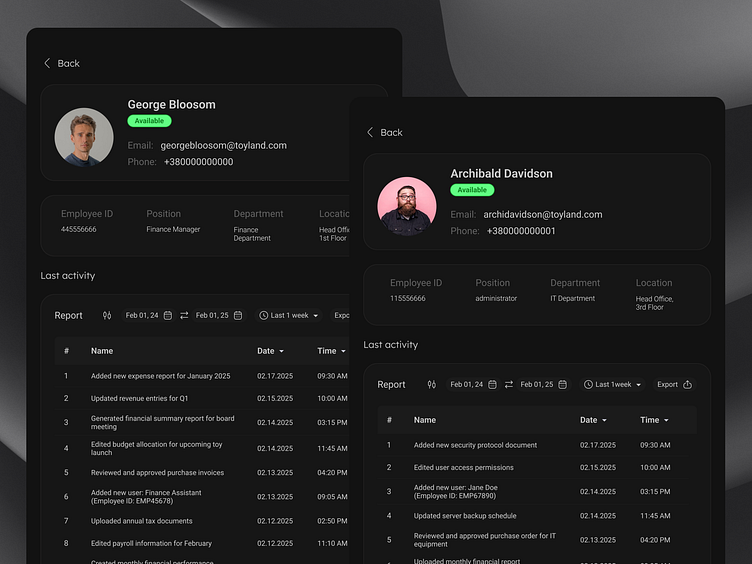
User Profiles
Detailed Employee Information: Includes availability, contact details, employee ID, position, department, and location.
Recent Activities: Lists recent actions performed by the user, enhancing transparency and collaboration.

Budget Planning
AI-Powered Analysis: The AI assistant in the widget provides detailed financial insights, helping users understand budget performance and identify trends.
Budget Categories: Compares planned vs. actual budget values, highlighting variances.
Notifications: Alerts about budget limit exceedances and target achievements, enabling proactive financial management.
Detailed Financial Analysis: The widget allows for an in-depth look into financial performance by category, including Revenue, Production Costs, Marketing, Administrative Costs, Shipping, and Net Profit.
Variance Analysis: Provides a clear visual representation of variances in dollars and percentages, making it easy to identify areas where the budget is not meeting expectations.
Real-Time Updates: Ensures that financial managers and accountants have access to the most current data, allowing for timely adjustments and decision-making.
User-Friendly Interface: Designed to be intuitive, even for users who may not have extensive financial backgrounds, ensuring accessibility for all relevant stakeholders.
New Budget Planning Table: Displays budget categories, actual vs. planned budget values, variances in dollars and percentages, highlighting financial performance and areas that need attention.


Outcome
This interface design provides a comprehensive tool for managing Toyland’s finances, improving data analysis, budget planning, and report generation. The intuitive and visually appealing design enhances user experience, making financial management more efficient and effective.
