Data visualization product design
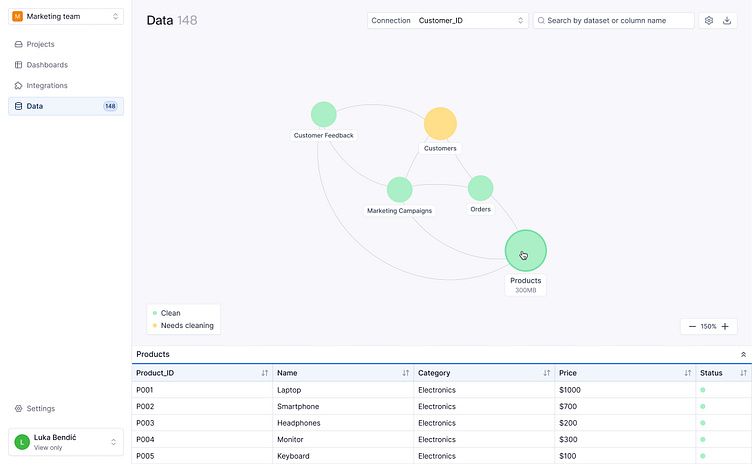
This project focused on designing a Knowledge Graph Interface that allows users to explore and interact with large datasets efficiently. The goal was to create a scalable, intuitive, and visually clear way to visualise data relationships, identify data cleanliness issues, and search for specific datasets.
Challenges & Objectives
🔹 Handle hundreds of datasets without overwhelming the user
🔹 Clearly indicate relationships through shared ID columns
🔹 Show data cleanliness status with colour-coded indicators
🔹 Enable search & filtering for quick dataset discovery
🔹 Ensure zoom functionality for better navigation
Design Approach
📍 Graph View – An interactive, zoomable network displaying dataset connections
📍 Data Cleanliness Indicators – Colour-coded markers (green = clean, yellow = needs cleaning)
📍 Search & Navigation – Quick dataset lookup with filtering options
📍 Table View – A structured list of datasets for detailed review
By balancing clarity, scalability, and usability, the final design enables data professionals to efficiently explore relationships and focus on data quality.