Activity Data Infographic
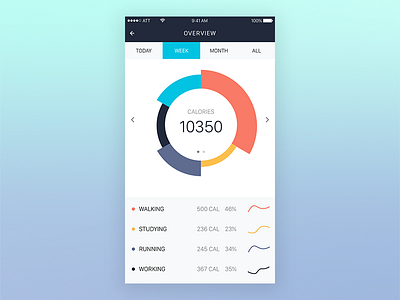


This is the visualization of one-month data from “Moves”: https://www.moves-app.com/
"Moves" helps users think about their life in a new way. Start with small changes that can lead to healthy habits and losing weight naturally.
Thus, by digging in these data, I’d like to focus on the information of calories and duration of activities. Plus, trending provides insights to help users readjust their activities in next day.
