CDI - Manchester University Infographics
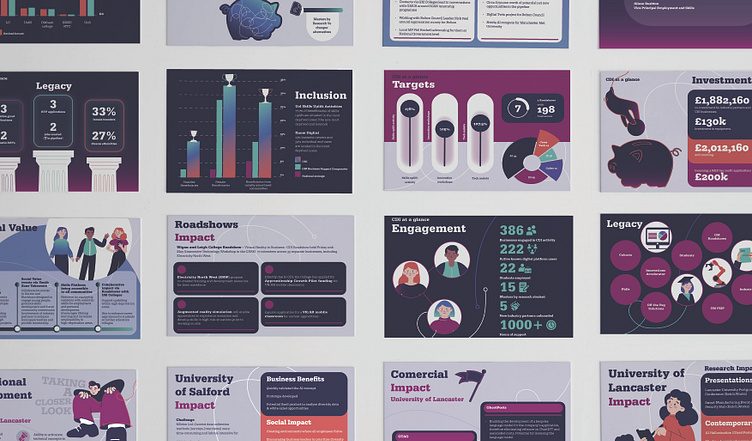
Pages from the illustrated infographic.
I created this full set of infographics for CDI at Manchester University, designing every page from scratch, in illustrator. I developed the brand colours, selected the fonts, and illustrated all the vector graphics and charts to bring the data to life. The goal? Making complex stats look good and easy to digest while keeping everything visually cohesive and engaging.

A Sample of some of the vector illustrations created
These vector illustrations for an infographic project, focus on making data analytics and educational narratives more accessible and engaging. AND I GOT TO MAKE THEM! Love it! Working on the design the client wanted clean lines, inclusivity, and a modern colour palette as well as a look that was professional AND approachable feel. Each character was created to aid in the telling of a larger story about data driven decision making and educational growth. It's always rewarding to help clients transform complex information into visual stories that resonate with their audience.
