Data Visualization: Tables for teacher
Data Visualization: Tables
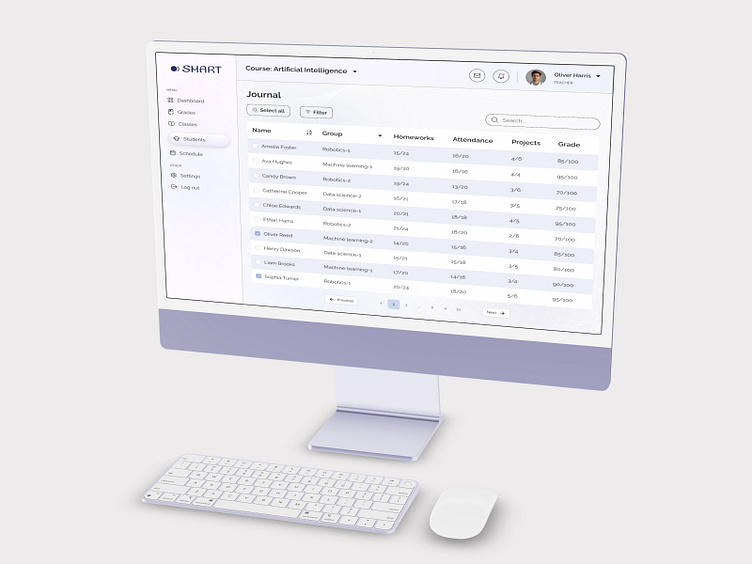
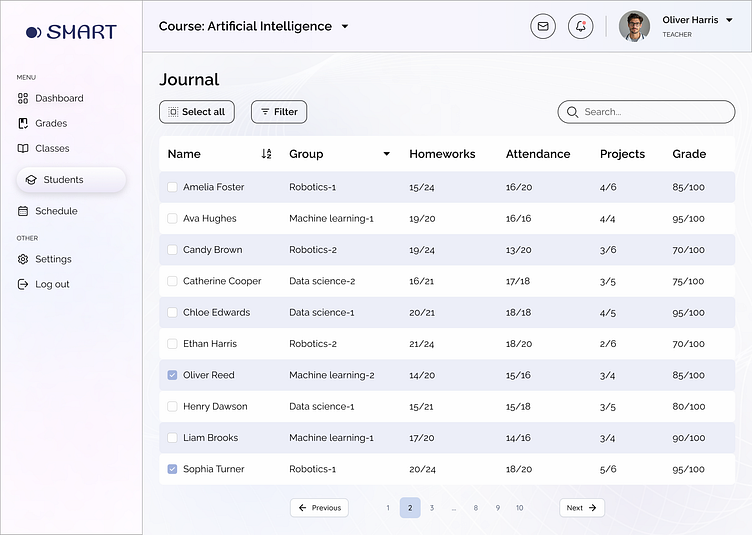
Tables for an edtech product aimed at students. Tables are often used to display structured information on websites and applications. A UI table for the teacher's gradebook has been designed for the "Artificial Intelligence" course at the IT school "SMART."
About: a clean and intuitive table design tailored for educators in the "Artificial Intelligence" course at "SMART" IT school. This UI facilitates efficient data visualization, allowing teachers to manage and analyze student performance seamlessly. Key features include sortable columns, color-coded performance indicators, and responsive design for various devices.
I am open to new projects and happy to collaborate! Please feel free to contact me via:
