Energy Consumption Dashboard UI
☀️ Powering the Future with Smart Solar UI 🌱
Imagine having a single tool that lets you track and optimize your energy usage. Fuselab Creative's Energy Consumption Dashboard makes this a reality.
Designed to give you clear insights into energy consumption patterns, this dashboard allows you to monitor power generation across different regions and sources, all in one easy-to-understand visual format.
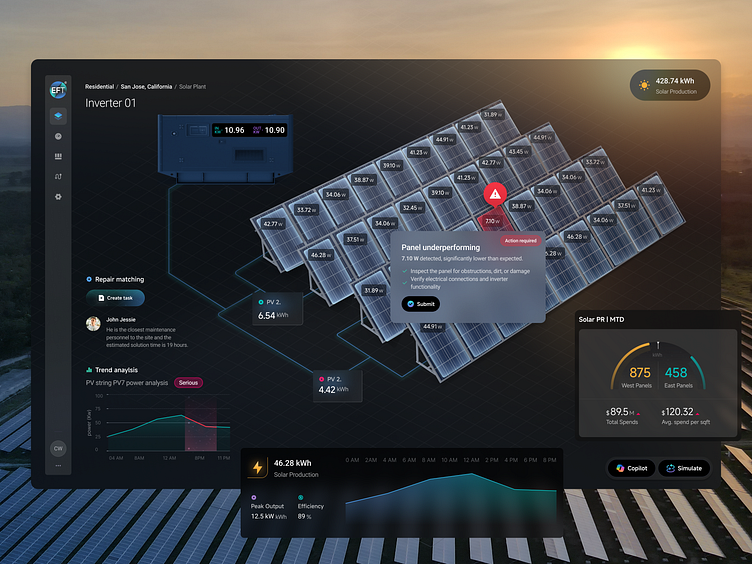
The dashboard's logic is built around multiple layers of data, offering a comprehensive view of energy consumption and production. Through a dynamic map, businesses can track the energy efficiency of individual facilities, compare performance across zip codes, and even pinpoint areas that need improvement. This geospatial analysis helps stakeholders make more informed decisions about where to invest in renewable energy solutions.
Check it out and let us know your thoughts! 🌍✨
If you love what you see,
Feel free to show some love 💕 and comment your thoughts 👀
Have a beautiful idea in mind?
Let's collaborate!
Email: georgerailean@gmail.com
Portfolio: georgerailean.com