Sales management - Sales performance
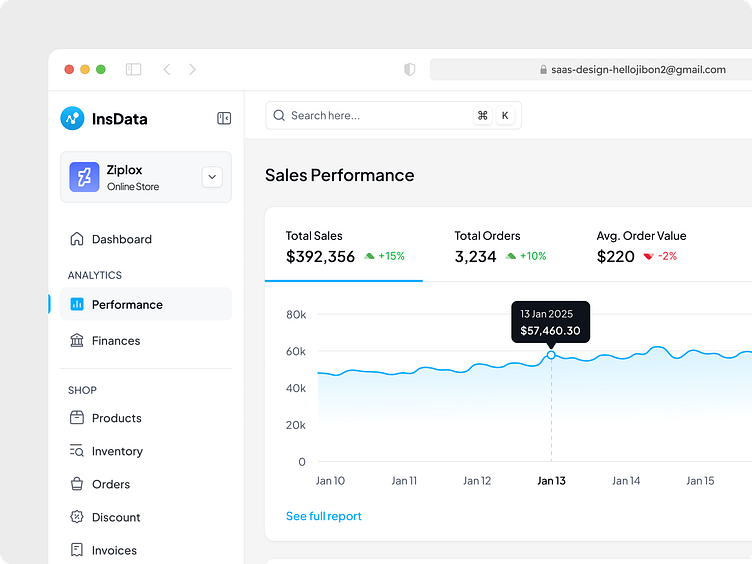
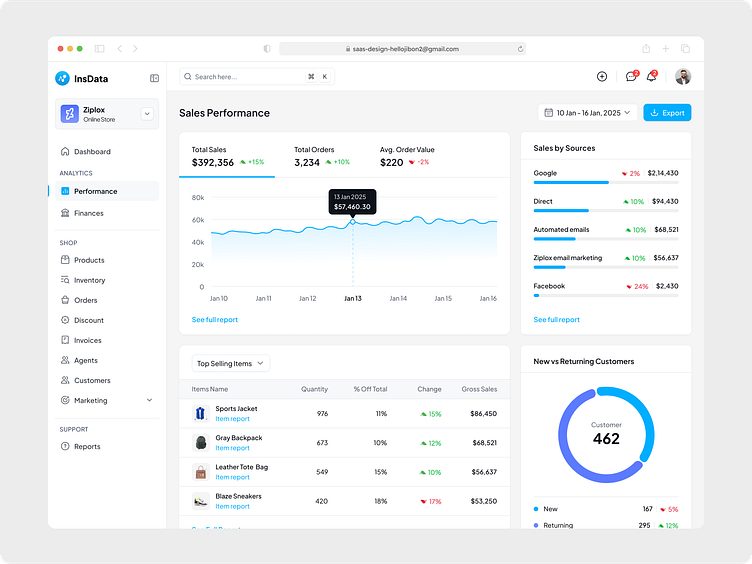
The sales performance dashboard provides a comprehensive view of business performance metrics, enabling users to monitor sales trends, order volume, and revenue sources over a selected time period. Key performance indicators (KPIs) displayed include total sales, total orders, and average order value, along with percentage changes. Interactive line graphs help visualize sales performance over time, while detailed breakdowns of sales by sources (Google, direct, email marketing, etc.) provide insights into revenue-driving channels. Additional widgets like top-selling items and new vs. returning customers offer deeper analytics into customer behavior and product performance, helping businesses make data-driven decisions.
Feel free to share your thoughts in the comments 💬.
Press "L" if you like ❤️ it.
----------
Have an awesome idea? 💡
I will provide you with a quick analysis and a free proposal for it. Don’t worry, it is secure and confidential.
📩Email me: hellojibon2@gmail.com | Whatsapp: +8801763204103
Follow me to see more exciting shots and insights on: Linkedin | Behance | X | Instagram |
