World Health Data Visualization
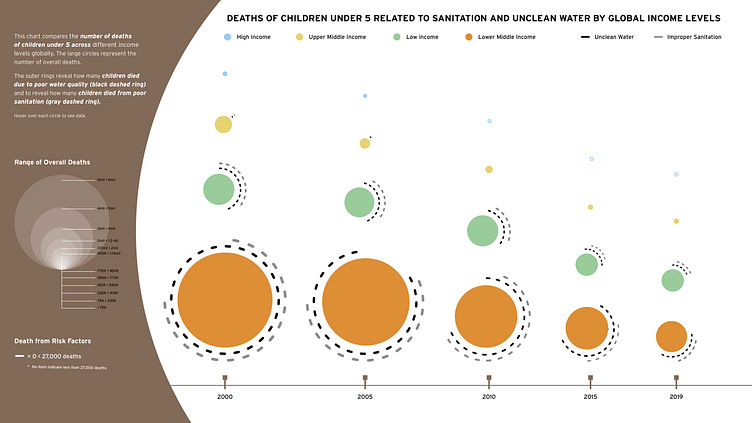
This project is broken into three graphs that all aim to expose the increased health risk associated with low income. The first graph looks at deaths of children under 5 across the globe related to sanitation and drinking water quality. It breaks it down by income to show how higher income communities experience less premature childhood deaths due to improper sanitation and unclean water.
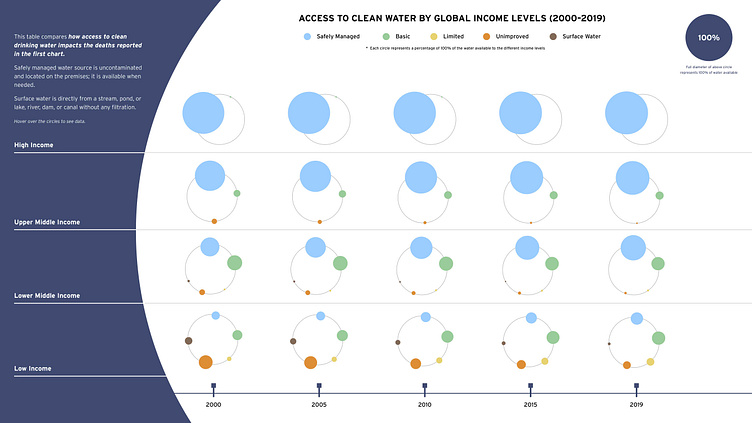
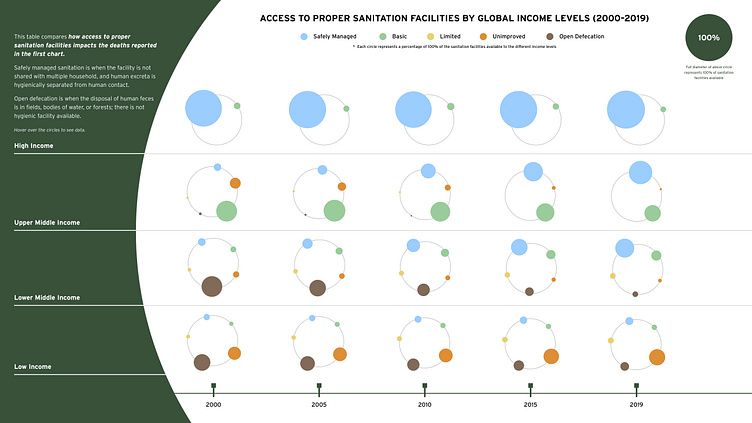
The second graph compares how income levels are correlated to drinking water quality across the globe, and the final graph compares how income levels correlate to sanitation quality across the globe.