Keeping eye on the market
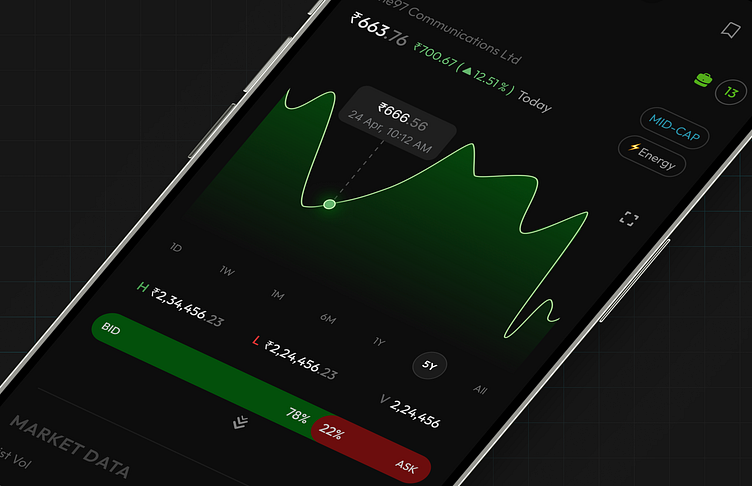
Stock Performance Overview
This screen provides an analysis of a stock's performance over a recent period, showing a notable increase in its value. The graph illustrates the stock's price movements, with key metrics like current price, historical volatility, 52-week high and low, and trading volume. The bid-ask spread shows a higher interest in buying compared to selling. Ideal for investors looking at mid-cap stocks with significant market activity.