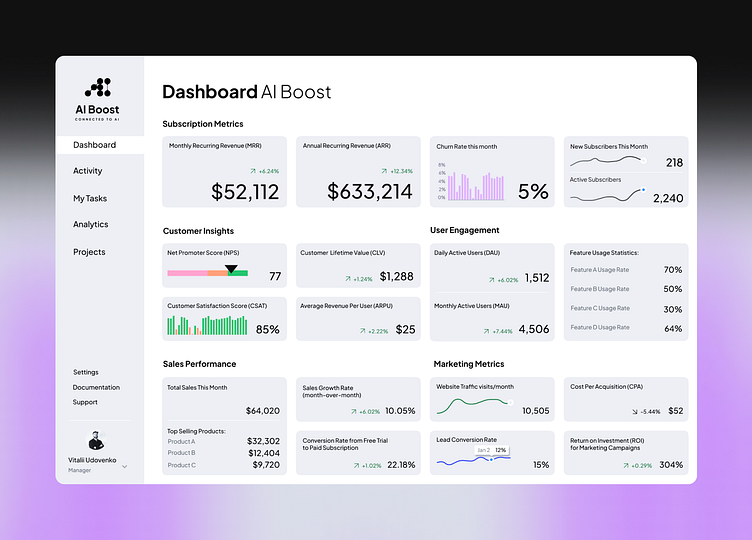
Sales Dashboard Design for AI Startup
Sales Performance Overview
Design Approach
Each dashboard design is tailored to meet specific purposes and cater to the unique needs of its intended audience.
A successful dashboard strikes a balance between functionality and aesthetics, ensuring that users can easily derive insights while enjoying an engaging visual experience.
The design focuses on clarity and accessibility, utilizing visual elements such as graphs and icons to enhance understanding. Each metric is presented with concise labels and tooltips for additional context, ensuring that users can easily interpret the data at a glance.
The layout is designed to facilitate quick comparisons and highlight key trends, empowering users to make informed decisions based on real-time insights.
As a UX/UI designer, I aimed to create an intuitive and visually engaging section dedicated to Subscription Key Metrics. This section provides a comprehensive snapshot of a subscription performance, allowing users to quickly assess the health of a business.
→ Monthly Recurring Revenue (MRR)
→ Annual Recurring Revenue (ARR)
→ Churn Rate this month
→ New Subscribers This Month
→ Active Subscribers
The Customer Insights section is designed to provide a comprehensive understanding of customer sentiment and value, enabling businesses to make informed decisions that enhance customer experience and drive growth. This section includes key performance indicators that reflect customer satisfaction and financial metrics related to user engagement.
→ Net Promoter Score (NPS)
→ Customer Satisfaction Score (CSAT)
→ Customer Lifetime Value (CLV)
→ Average Revenue Per User (ARPU)
The User Engagement section provides vital insights into how users interact with the platform, helping businesses understand user behavior and optimize their offerings. This section highlights key metrics that reflect user activity and engagement levels over time.
→ Daily Active Users (DAU)
→ Monthly Active Users (MAU)
→ Feature Usage Statistics
The Marketing Metrics section offers critical insights into the effectiveness of marketing efforts, enabling businesses to assess performance and optimize strategies. This section highlights key indicators that reflect both user engagement and financial efficiency in marketing initiatives.
→ Website Traffic visits/month
→ Lead Conversion Rate
→ Cost Per Acquisition (CPA)
→ Return on Investment (ROI)for Marketing Campaigns
Creating a Bird-Eye Vision System for your company involves designing a comprehensive, high-level analytics dashboard that provides an overarching view of key business metrics across various departments. This system will enable stakeholders to monitor performance, identify trends, and make data-driven decisions efficiently.
Write me here for connect and work: vitteodesign@gmail.com
Thank you!
