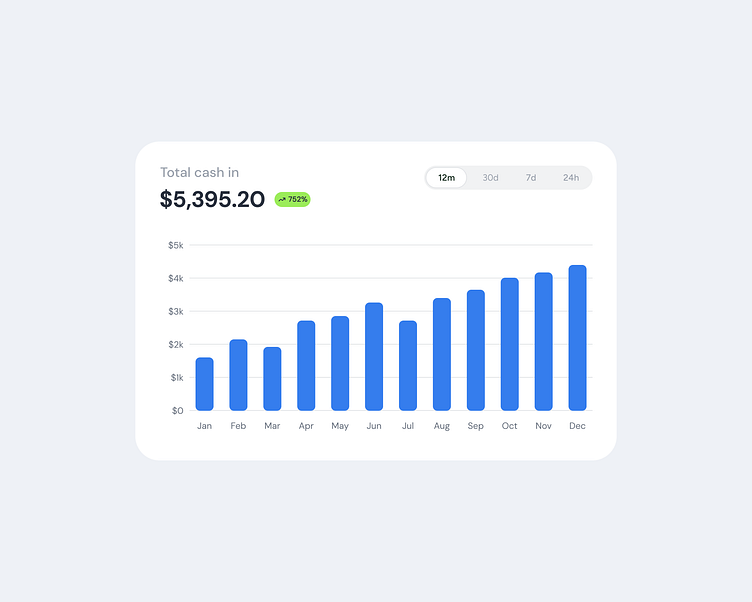
Cash flow bar graph UI Design
This bar graph UI design visualizes cash flow trends with clarity and precision. The clean layout and interactive time filters make it easy for users to analyze financial data over various periods, enhancing decision-making.
Why this design works
The bold bars and simple labels provide an at-a-glance understanding of cash flow trends.
Interactive time filters (12 months, 30 days, 7 days, 24 hours) allow users to customize their data view, offering flexibility and control.
This design is perfect for dashboards aiming to present financial data in an intuitive and engaging way.
Let’s create data-driven experiences
At Block Agency, we specialize in designing modern UI/UX solutions that transform complex data into actionable insights. From bar graphs to full dashboards, we create tools that empower users.
📩 Contact us at hey@blockagency.co
Discover more at Block Agency or connect with me on Upwork. Proud to be Top Rated Plus.
