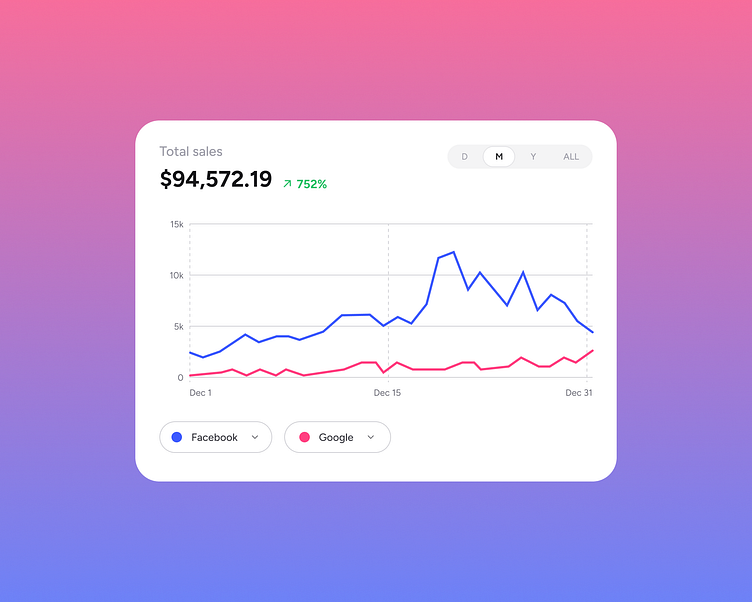
Sales performance line graph UI Design
This line graph UI presents data in a clear and engaging way, making it easy for users to track sales performance over time. Its clean layout and intuitive controls provide a seamless data visualization experience for dashboards and analytics platforms.
Why this design works
The bold typography and color-coded lines ensure data is easy to interpret at a glance.
Interactive filters, such as daily, monthly, and yearly views, allow users to customize the data display, enhancing usability.
This design is perfect for dashboards aiming to simplify complex data and improve decision-making processes.
Let’s visualize data that drives action
At Block Agency, we craft modern and functional UI/UX designs for analytics and data-driven platforms. From graphs to complete dashboards, we deliver solutions that transform data into insights.
📩 Contact us at hey@blockagency.co
Discover more at Block Agency or connect with me on Upwork. Proud to be Top Rated Plus.
