Analytics Dashboard
Introducing a sleek, minimalist Analytics Dashboard that provides real-time insights and trends to help businesses thrive.
Highlights of the Design:
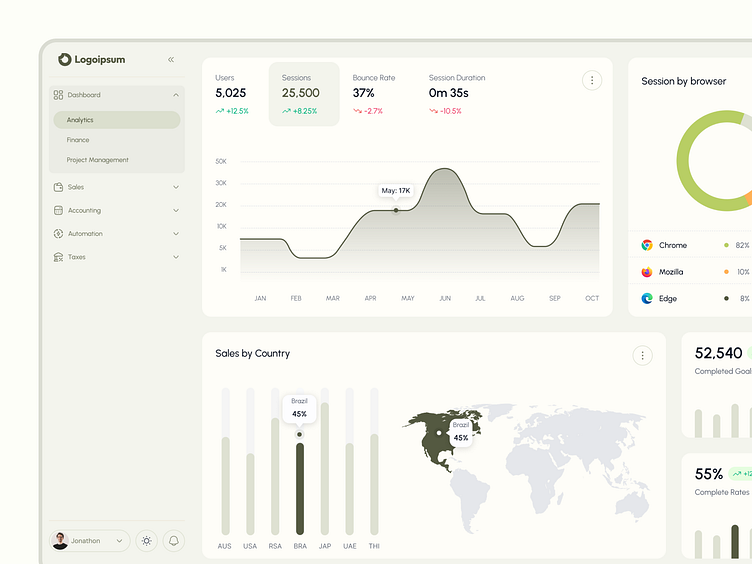
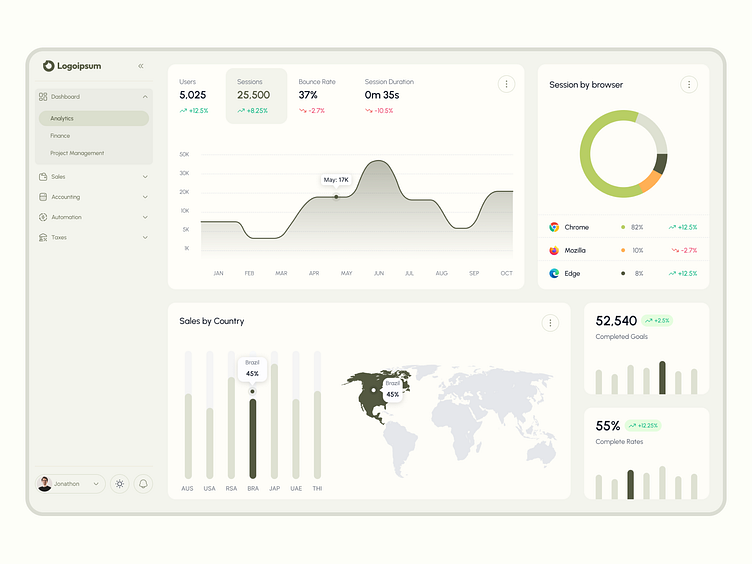
Key Metrics at a Glance: Overview of Users, Sessions, Bounce Rate, and Session Duration with easy-to-interpret stats and percentage trends.
Dynamic Line Graph: Visualize session trends over months with interactive data points for precise analysis.
Session by Browser: Pie chart displaying browser usage percentages, complete with performance changes.
Sales by Country: Bar graph and map integration for visualizing country-wise sales performance.
Completed Goals and Rates: Quick access to goal completion data with growth indicators for enhanced monitoring.
Why It Stands Out: A refined design combining functionality with simplicity, ensuring businesses can focus on what matters most—data insights. The subtle color palette and modern components make it visually appealing while retaining high usability.
Collaborate with me! Drop a line at rayhannasirinfo@gmail.com or Visit at -rayhannasir.com
Follow me for more amazing designs:
Don't forget to like and share your valuable feedback in the comment section.
