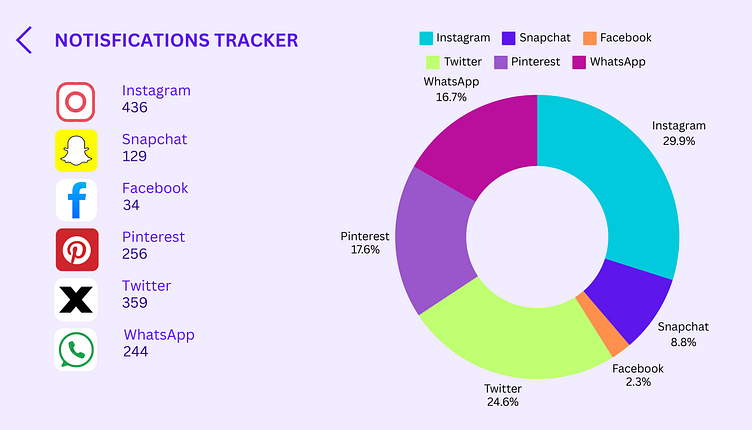
Analytics Chart | DailyUI Challenge #018
This is the day 18 of my 100 days challenge from DailyUI.
The task was to create an Analytics Chart. I made one related to social media apps and the number of notifications received in each app. It was my first time using charts in Canva. It was good but according to me Google Spreadsheets is a better option to make charts.
Thanks for reading. Do give your valuable feedbacks!
More by Rashmi Pant View profile
Like
