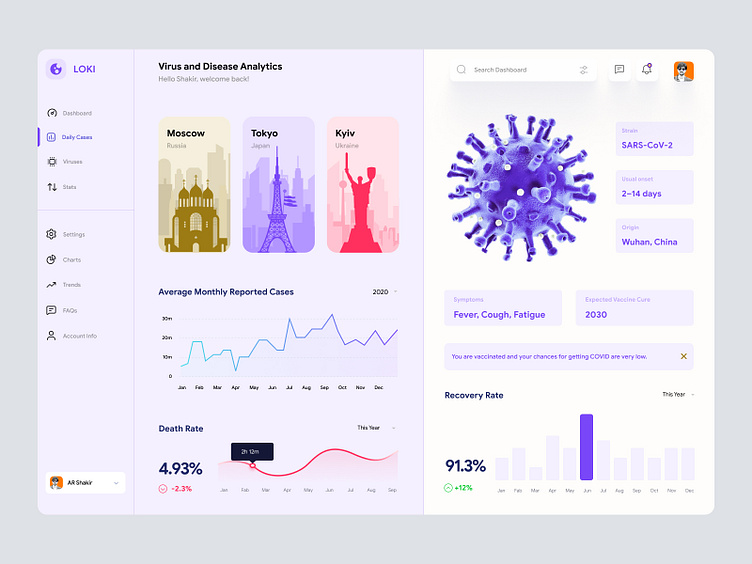
Covid Analytics Dashboard UI
🦠 Virus and Disease Analytics Dashboard
Here’s a clean and modern Disease Analytics Dashboard designed to keep important health data at your fingertips! 🩺
Key Features:
• City Highlights: Track virus cases in major cities like Moscow, Tokyo, and Kyiv with intuitive visuals.
• Strain Details: Comprehensive info on virus strains, symptoms, and origins.
• Case Trends: Interactive charts for average monthly cases, death rates, and recovery rates.
• Insights: Vaccination updates and projected timelines for vaccine developments.
• Sleek UI: A soft color palette paired with sharp graphics for easy understanding.
This dashboard is built for clarity and functionality—making data analysis simple and effective. What do you think? Show some ❤️ if it resonates with you!
#DataAnalytics #DashboardDesign #HealthcareUI
