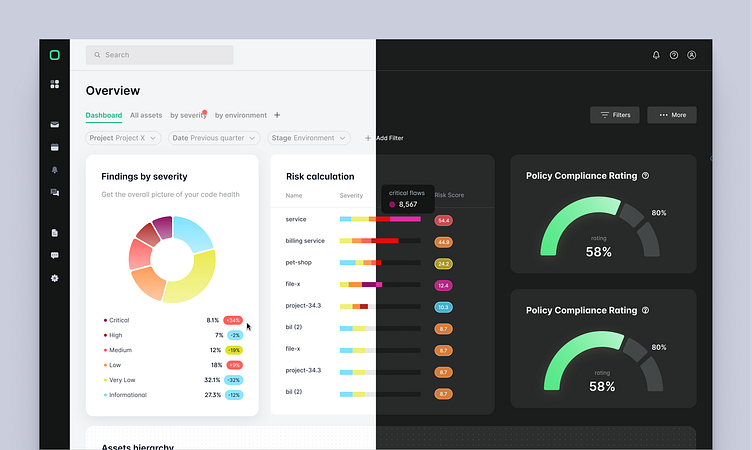
Security Dashboard
The Analytics Dashboard Overview design focuses on providing a clear, intuitive visualization of critical metrics, enabling users to assess platform performance at a glance
In January 2022, NDA's company sought to boost customer satisfaction and retention by improving the platform’s analytics, after discovering only 24% of Application Security Leads easily found the analytics tab, prompting UI/UX enhancements and guided onboarding.
Findings by Severity: A donut chart presents an engaging summary of code health categorized by severity levels, accompanied by percentage breakdowns and trend indicators (+/-%), allowing users to identify high-risk areas quickly.
Risk Calculation: A horizontal bar chart offers detailed insights into the severity and risk score for various services, providing actionable data to prioritize issues efficiently.
Designed by Olena specifically for gemux.design.
Olena Horbachenko | IG | BE | LI
Want to make a revolution with aesthethic and functional interface?
Visit gemux.design or ping us at hello@gemux.design.


