E-Commerce Dashboard
Data Process?
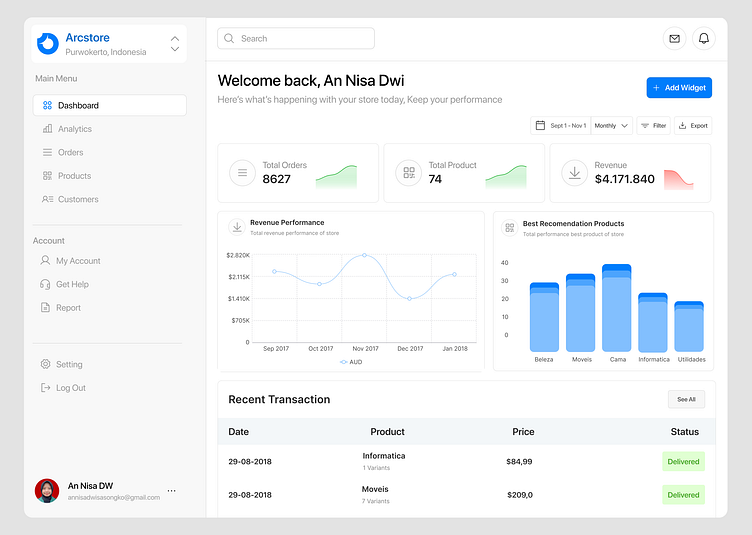
I had the incredible opportunity to collaborate with An Nisa Dwi Sasongko, to create an E-Commerce Performance Dashboard using a public dataset from Dicoding Indonesia’s final project on the data learning path, Learn Data Analysis with Python.
While An nisa managed the data process through defining questions, data wrangling, and exploratory data analysis (EDA) in Google Colab, I focused on transforming the insights into a visually intuitive and user-centric dashboard design.
My goal was to ensure the dashboard aligned with cleaned data, offering clear, impactful visuals to make data-driven decisions easier. With Figma, I brought the data to life through thoughtful layouts, engaging design elements, and a user-friendly interface.
This collaboration demonstrates the magic that happens when data meets design—creating solutions that are not just functional but also visually impactful! 🚀
