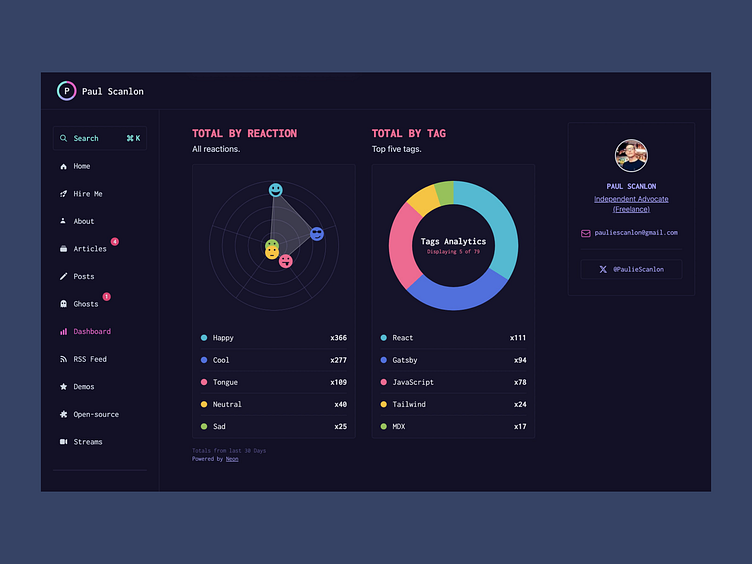
Illustration: Visual Representation of Reactions and Tags
This interactive dashboard design presents key analytics in a visually appealing way, utilizing engaging graphs and charts to display reactions and top tags, ideal for tracking personal content engagement.
Reach out at:
More by illuminar View profile
Like
