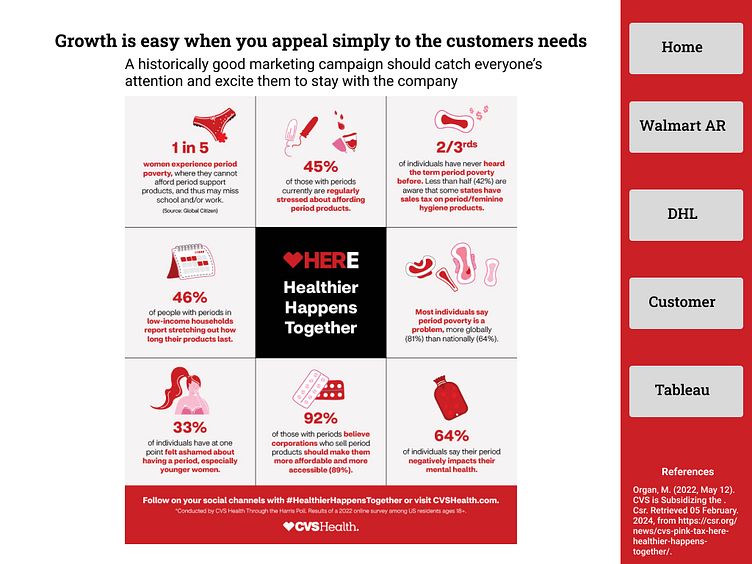
Infographic Example
I designed a marketing campaign infographic using Figma. The App marketed for was CareMart and the design problem was to create an in store scan feature. This would be used to help customers find the products and make purchases.
I used Tableau for the last slide. From the research shown there was a 12.5 percent profit ratio from Sales per Customer. The focus was on the states highlighted in orange.
More by Brian G View profile
Like


