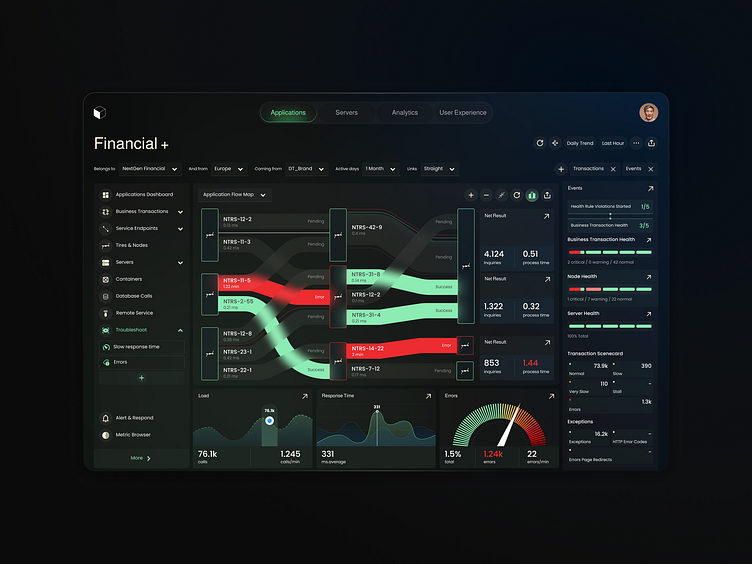
Data Heavy Dashboard
Client Request
Technology-driven financial services provider, sought a high-performance dashboard to monitor complex application infrastructures in real-time. Their main requirement was to centralize data across various systems and servers, allowing their IT and DevOps teams to detect and resolve issues swiftly. They requested a dashboard that could provide an intuitive overview of transaction flows, error rates, and system health metrics, ensuring smooth, reliable operations for critical financial applications.
About
This project involved designing a comprehensive Financial + Monitoring Dashboard that enables IT and DevOps teams to maintain oversight of application performance and server health in real time. The dashboard visualizes application flow maps, transaction success rates, error logs, and response times. By focusing on a streamlined, data-driven interface, the dashboard provides users with actionable insights, helping them quickly identify issues and optimize performance across their infrastructure.
Challenge
Users responsible for financial applications face the challenge of maintaining uptime, reliability, and efficiency across multiple systems under heavy traffic loads. They often deal with fragmented data from various servers and applications, which makes it difficult to identify and resolve performance bottlenecks or errors. Additionally, users need a tool that allows for rapid diagnosis and troubleshooting, as any downtime or slow transactions could directly impact customer satisfaction and financial outcomes.
Connect with me


