#DailyUI018-Analytics Chart
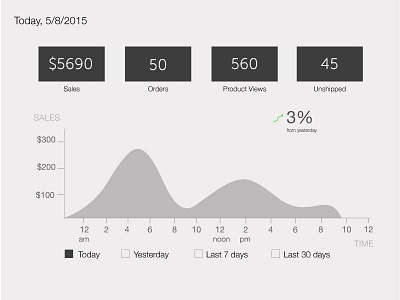
The eighteenth challenge was an Analytics chart. In this scenario, an e-commerce seller sees the Sales card(see attachment) and clicks on the graph icon to see a more detailed view(the shot)
More by Nivi Harishankar View profile
Like

