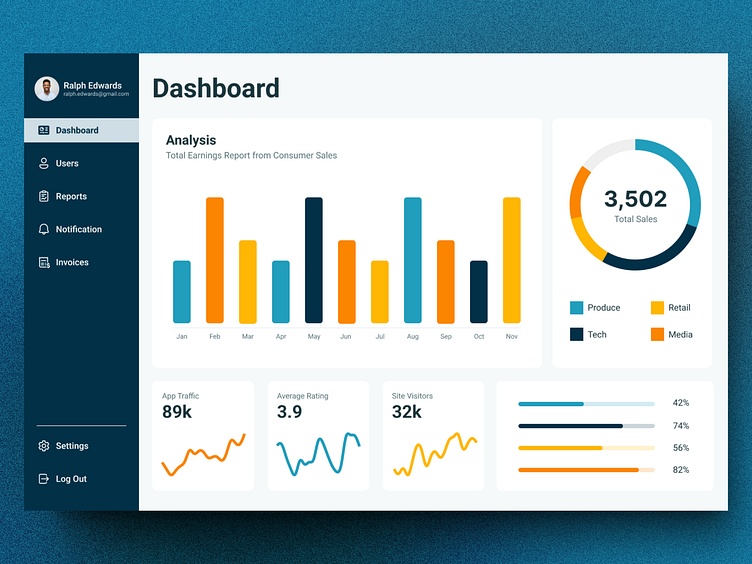
018 | Analytics Chart
018 | Daily UI Challenge: Analytics Chart
Analytics Chart. Sample Dashboard Interface User would encounter to analyze and view recorded data.
Created Using Figma
I am available for work! Let's bring your ideas to life and create something great together!
Email: jalencgooch@gmail.com
More by Jalen View profile
Like
