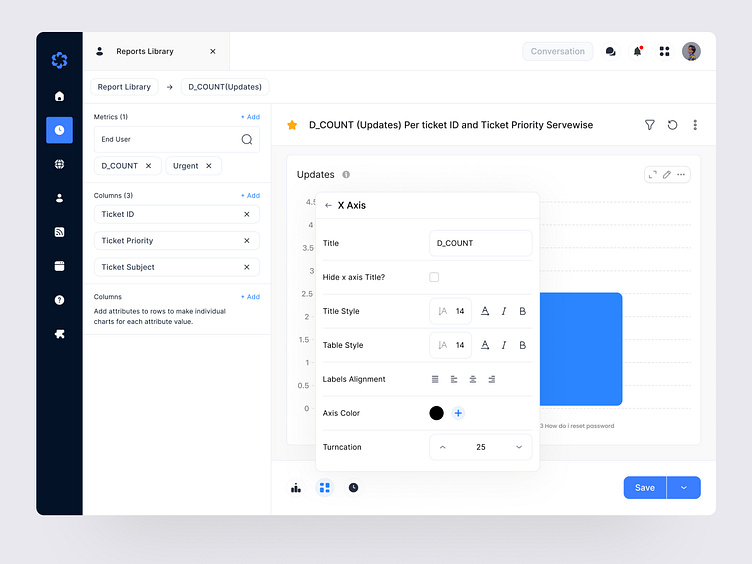
Report Library Dashboard
Dive into data with ease! This dashboard design for the Reports Library is built for efficiency, helping users customize their data views without overwhelming the interface.
With intuitive options for adjusting metrics, columns, and visual attributes, users can tailor each report to suit their analytical needs. The clean layout and easy-to-navigate style settings create a smooth experience, allowing users to focus on insights instead of interface clutter.
What do you think of this approach to data visualization? Comment below! 👇
Find us on:
🏀 https://dribbble.com/MagikaStudio
🎨 https://layers.to/magikastudio
🔥 https://flames.design/magikastudio
📷 https://www.instagram.com/magika.studio/
Have an amazing project? Send to our email:
Thanks for Scrolling👋
More by MAGIKA View profile
Like
