UX/UI of the Dynamics of Indicators functionality
UX/UI функционала Динамика показателей
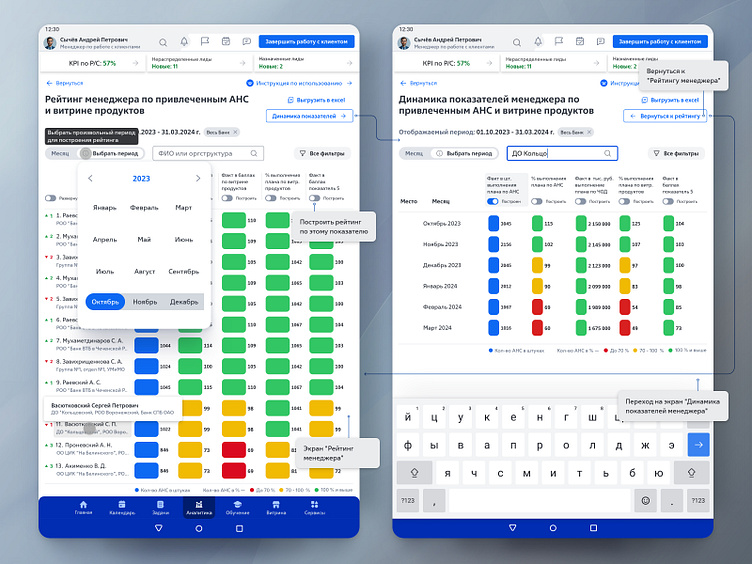
В компании имеется мотивирующий инструмент "Рейтинг менеджера", который отображает уровень продаж любого менеджера по продажам за выбранный период. Данным дашбордом пользуются не только менеджеры, но и их директора. На встрече с пользователями - Директорами обозначена боль: исходя из одного выбранного периода не всегда понятно, насколько хорошо менеджеры отработали в текущем временном периоде по сравнению с прошлым аналогичным периодом, например хорошие текущие показатели могут быть ниже аналогичных в прошлом периоде. Решение: реализован функционал "Динамика показателей менеджера". Директор выбирает в фильтрах иерархический срез, выбирает произвольный период из нескольких месяцев, переходит в функционал Динамика показателей. Здесь Директор видит необходимые ему для аналитики показатели разбитые по месяцам сразу на одном экране. Во "всех фильтрах" Директор может настраивать отображение необходимых ему показателей. Результат: Директор понимает, как его подчинённые отработали в динамике на протяжении одинаковых отрезков времени, у кого положительная динамика а у кого отрицательная. После этого Директор проводит работу с подчинёнными или с иерархическим блоком подчиненных, направленную на улучшение показателей продаж. Показатели продаж восстанавливают положительную динамику, бизнес и сами сотрудники начинают получать больший доход, а Директор получает в своё пользование функционал облегчающий его работу. Представлены экранные формы дизайна под планшет, для операционной системы Андройд в разрешении 800х1280 пикселей.
UX/UI of the Dynamics of Indicators functionality
The company has a motivating tool called "Manager Rating" that displays the sales level of any sales manager for a selected period. This dashboard is used not only by managers, but also by their directors. At a meeting with users - Directors, a pain point was identified: based on one selected period, it is not always clear how well managers have worked in the current time period compared to the previous similar period, for example, good current indicators may be lower than similar ones in the previous period. Solution: the "Dynamics of Manager Indicators" functionality has been implemented. The Director selects a hierarchical slice in the filters, selects an arbitrary period of several months, and goes to the Dynamics of Indicators functionality. Here, the Director sees the indicators he needs for analytics, broken down by month on one screen at once. In "all filters", the Director can customize the display of the indicators he needs. Result: The Director understands how his subordinates have worked dynamically over the same periods of time, who has positive dynamics and who has negative ones. After this, the Director works with subordinates or with a hierarchical block of subordinates, aimed at improving sales indicators. Sales indicators restore positive dynamics, the business and the employees themselves begin to receive more income, and the Director receives functionality that makes his work easier. Screen forms of the design for a tablet are presented, for the Android operating system in a resolution of 800x1280 pixels.
More about the project:
https://www.behance.net/megadot
https://www.deviantart.com/alexey-starodumov/gallery/36587088/web-design
https://www.artstation.com/megadot
