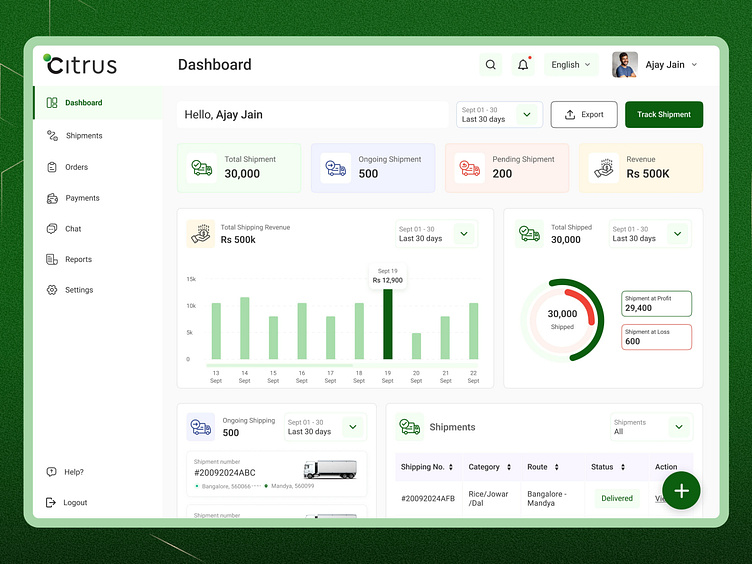
Freight Dashboard and Shipment Tracking
Dashboard: It shows total shipments, active shipments, total revenue, and pending, with accurate data and refreshed daily.The bar chart updates daily and displays accurate revenue data for each day over the past 30 days.The pie chart visually reflects the ratio between profit and loss at shipments in real-time. A detailed table is available showing shipment details, status, and actions for each shipment.User can export data and apply date filters to view shipments from different time periods accurately.
Shipment Tracking: The platform immediately displays a real-time map showing the location of the truck transporting the produce.If there’s any delay or change in the route, user will receives an alert via notification.The platform has helped user reduce reliance on middlemen by offering real-time updates and transparent supply chain tracking.


