Continuous profiling
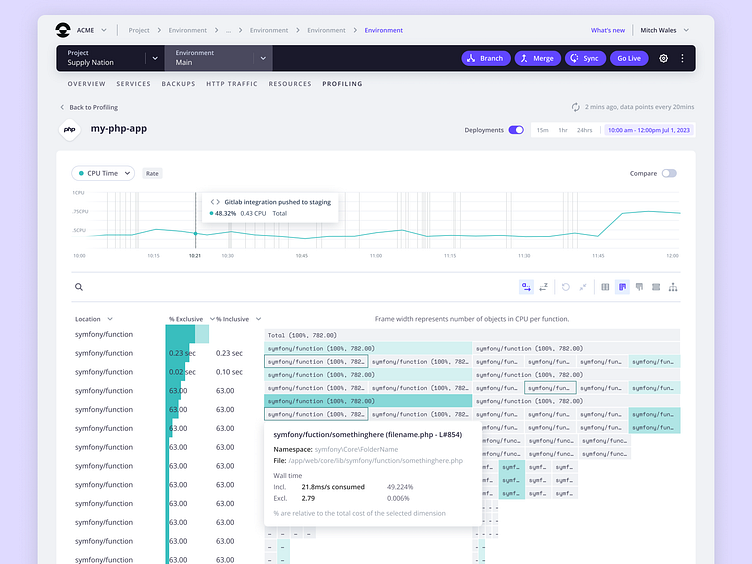
Continuous profiling collects real-time performance data from your applications as they run. Giving a view of your functions or methods over time allows users to view resource usage and quickly identify bottlenecks in performance. Hovering over one function will highlight anywhere that function repeats in the flamegraph which also gives importance to which functions or methods to optimize.
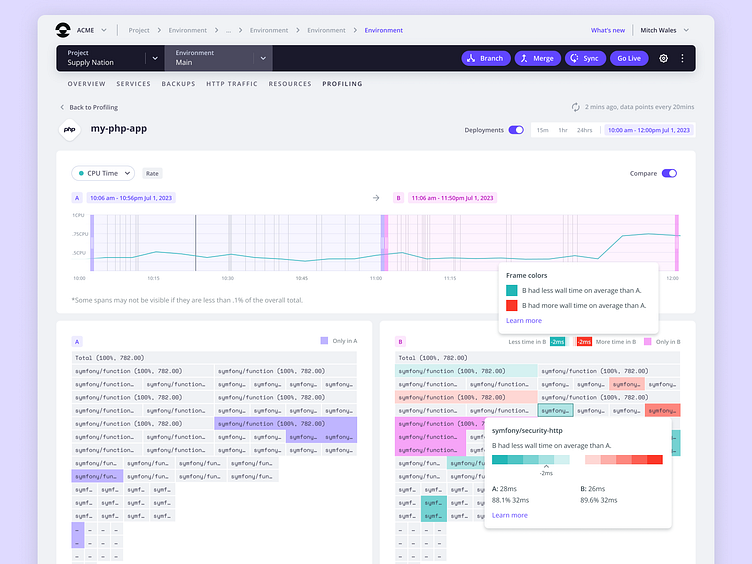
Comparison: Enabling the comparison feature allows you to compare the performance of two points in time. You can quickly find the functions unique to their timeframe in the purple or pink. On the second timeframe, you can see functions that are quicker than the first timeframe in green, and functions that are slower in red.
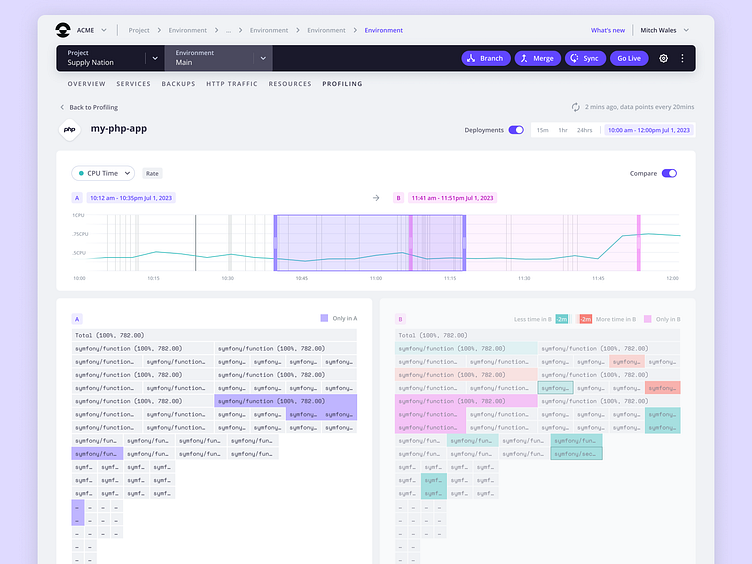
Section A: As you make adjustments to the timelines, clicking the A section will highlight the timeframe of section A and dim out section B on the right allowing users to focus on the information from their active selection.
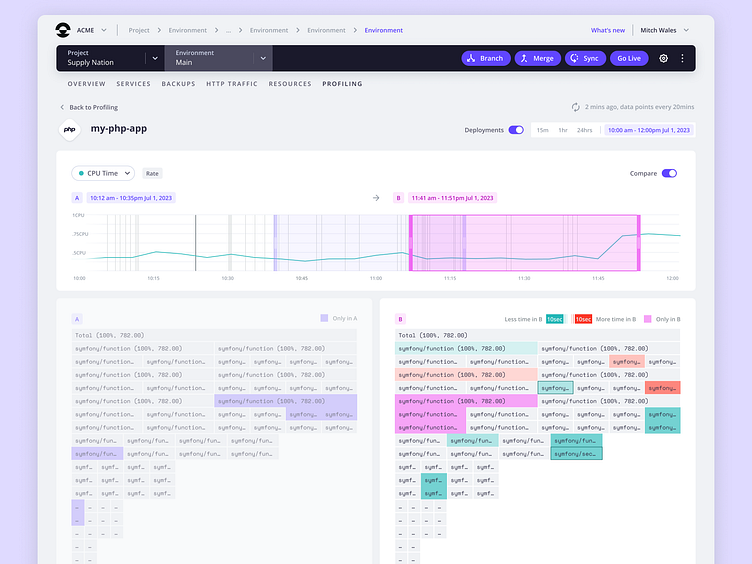
Section B: As you make adjustments to the timelines, clicking the B section will highlight the timeframe of section B and dim out section A on the left.