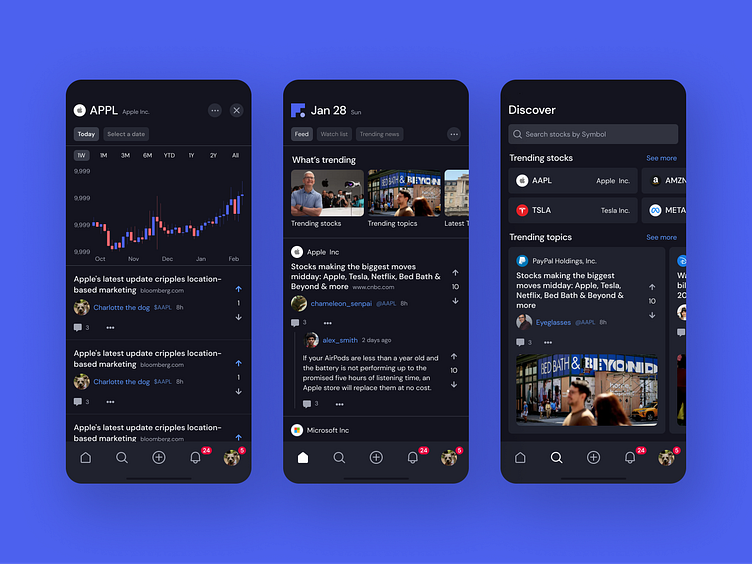
Fnchart Mobile App UI
Fnchart is a mobile app that helps investors make sense of stock price changes by giving context. Think of it like a blend of Reddit and stock charts: it combines real-time financial news with discussions from users and connects it all directly to stock price movements. You can click on a stock's price drop or spike and see what was happening at that time—whether it was a major company decision or a broader market trend.
Plus, users can vote on news stories, so the most relevant ones rise to the top. Fnchart also has a feature called the "Sentiment Discovery Dashboard" that tracks market trends and gives deeper insights into how people are feeling about certain stocks over time. It’s designed to make financial information easier to navigate and more interactive
My roles
Creating UI components, define color palette, font system, and develop animated prototypes
Onboarding UI
Welcome | Sign Up | Set Time Zone | Suggested Stocks | Users to Follow
Search UI
Trending News | Trending Topics | Who to Follow | Latest News | Featured Topics
User pages and notification UI
My page | Notifications | Messages


