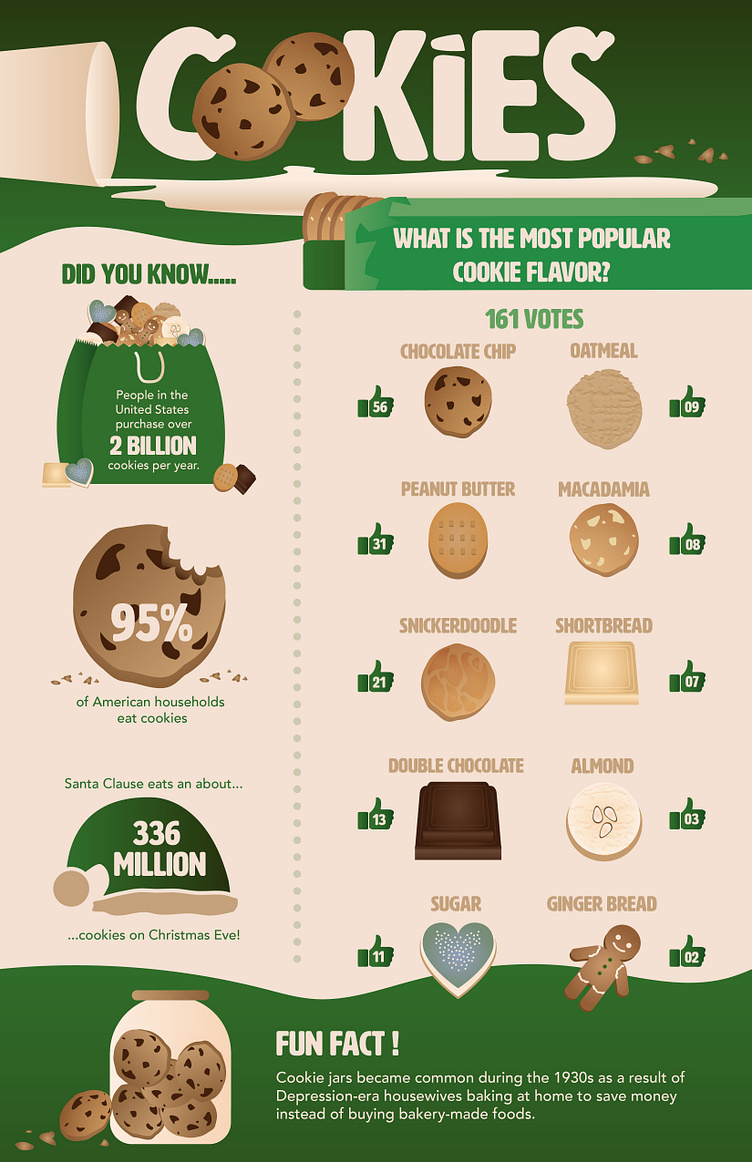
COOKIES - infographic
For this class project, the assignment was to Illustrate a visual image to represent any given activity, job or information. We had to develop a Mixed Infographic. We were told to use charts, diagrams and/or illustrations through a series of images, that visually explained the narrative. I made my infographic about cookies! Which cookies is the most Popular, Percents and a Fun Fact. The Information was obtained through the internet.
More by Noema Medina View profile
Like
