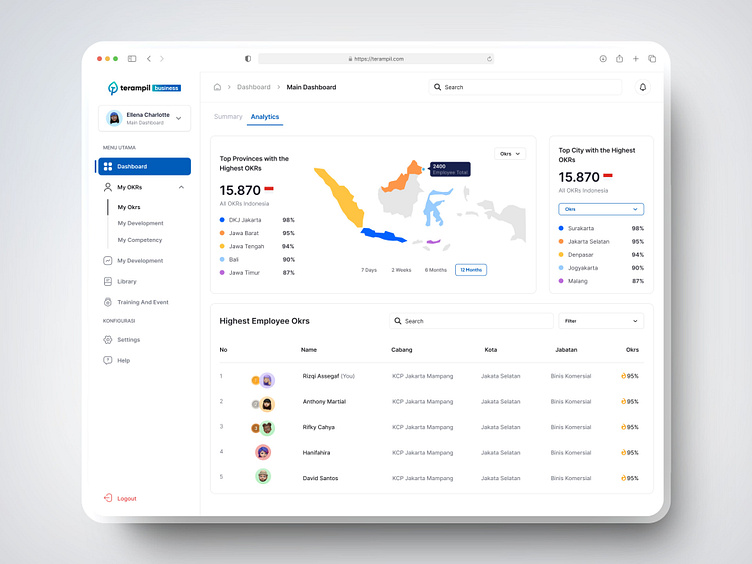
Terampil Dashboard Redesign
Employee Rank & Regional Performance Analytics: Here, the focus is on visualizing company progress and financial data. Key metrics such as development progress, revenue, and company profit are represented through interactive graphs and charts. The goal was to create an accessible dashboard where users can quickly assess their company’s performance at a glance.
Company Progress & Financial Overview Here, the focus is on visualizing company progress and financial data. Key metrics such as development progress, revenue, and company profit are represented through interactive graphs and charts. The goal was to create an accessible dashboard where users can quickly assess their company’s performance at a glance.
Dashboard - Personal OKRs & Development Overview This dashboard design highlights personalized OKRs, development progress, and certifications for users. The goal was to create an engaging and user-friendly interface where employees can track their progress, access training, and stay on top of reminders and activities. The use of clean visuals and interactive elements enhances the overall user experience.


