Mobile Analytics Dashboard – Data at Your Fingertips
Description: This mobile analytics dashboard design provides users with a comprehensive overview of key performance metrics in a sleek and user-friendly interface. Tailored for business owners, marketers, and web analysts, the dashboard offers critical insights into website performance, revenue, and visitor behavior in real-time, all within a mobile app experience.
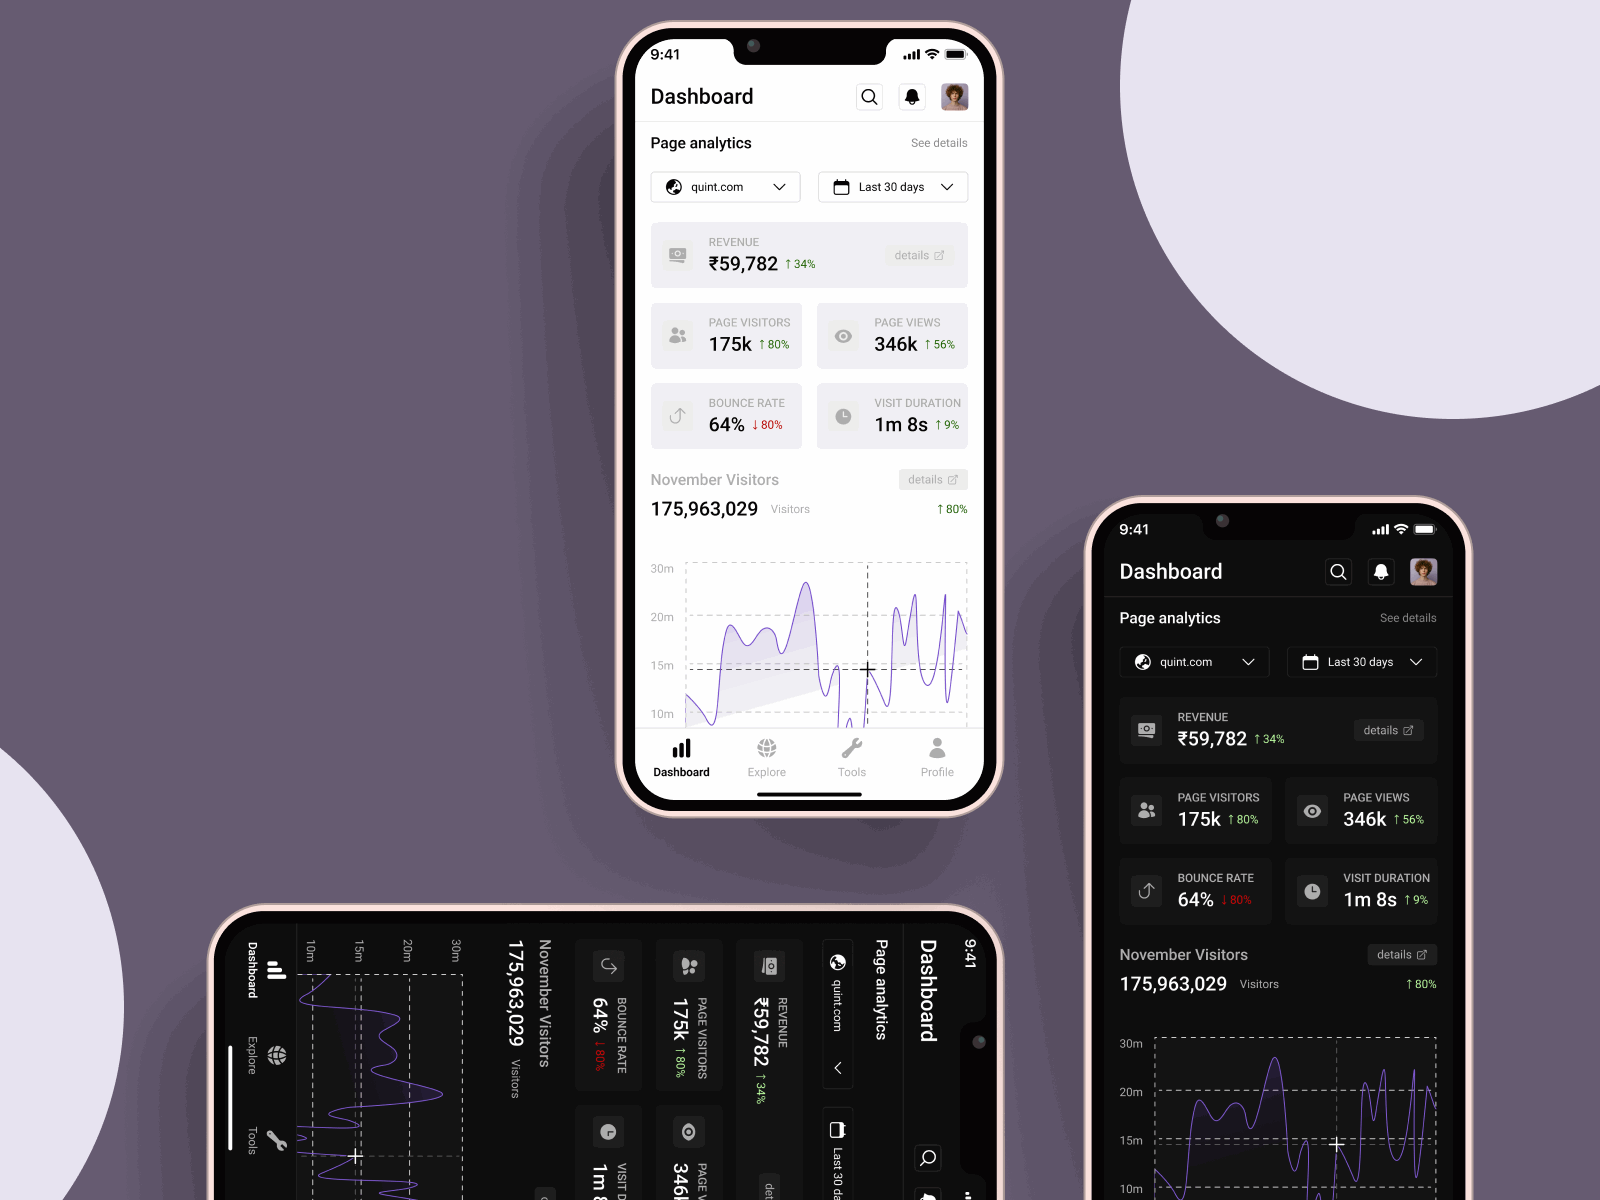
Core Metrics Display: The dashboard presents vital statistics such as revenue, page visitors, bounce rate, and visit duration prominently at the top of the screen. Users can quickly gauge their site's health and performance trends at a glance.
Clean & Minimalist Interface: The design emphasizes clarity with a clean, minimalistic approach. Key figures are highlighted with contrasting text colors, making it easy to spot changes in metrics such as page views and bounce rates. The white space and organized layout prevent data overload, while subtle graphs give visual context to the numbers.
Interactive Data Visualization: A line graph visualizes traffic trends over a selected time period, helping users to spot patterns in visitor engagement. This interactivity allows users to zoom in on specific periods for more detailed analysis.
Light and Dark Modes: This design features both light and dark modes, offering flexibility for users to choose their preferred interface style. The light mode exudes professionalism and simplicity, while the dark mode provides an elegant, focused view, especially in low-light environments.
Comprehensive Analytics Tools: Users can select the time frame of data, such as the last 30 days, to view the latest insights. They can also drill down into each metric for more granular details, like specific bounce rate factors or visitor sources, by clicking on "details."
Adaptive for Professionals: The dashboard design ensures that users who are always on the go have all the essential information they need in one place. It’s perfect for professionals who require a snapshot of their website's performance at any time, from anywhere.
User-Centered Design: The navigation is intuitive, with the dashboard, explore, tools, and profile tabs clearly visible and accessible at the bottom of the screen. This bottom-tab navigation ensures easy switching between different sections of the app without overwhelming the user.
Data-Driven Decisions: With this app, users can make informed decisions based on real-time data. Whether it’s tracking a spike in visitors or detecting an increase in bounce rate, users can immediately act on insights to improve their website’s performance.
