Widget Design Collection
🚀 Widget Design Collection – Sales & Business Performance
Here’s a look at a comprehensive widget collection designed to provide key business insights through a variety of charts and visualizations. Each widget focuses on tracking sales performance, employee distribution, and more.
Widgets & Charts Featured:
Sales Revenue Widget Shows total sales revenue and customer retention with a comparison to the previous period. A clean, data-driven overview to track business growth.
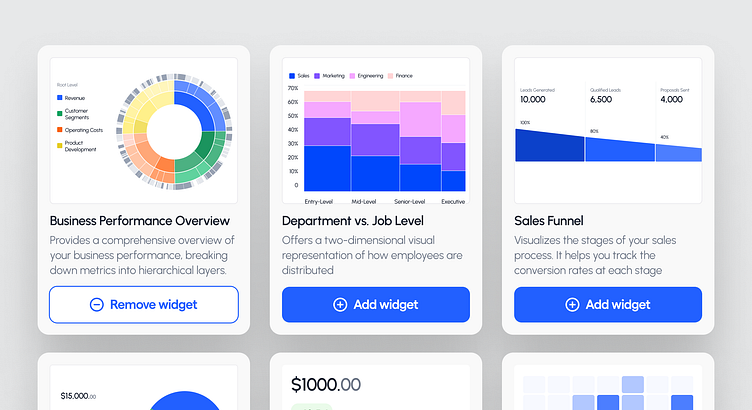
Sunburst Chart – Business Performance Overview Visualizes the contribution of various segments like revenue, customer segments, and operating costs to the total business performance. Perfect for seeing where your efforts are paying off.
Marimekko Chart – Employee Distribution Shows a breakdown of employees across departments and job levels, helping optimize workforce planning and identify areas for improvement.
Funnel Chart – Sales Funnel Tracks the movement from leads generated to closed deals. This widget breaks down each step of the sales process, helping teams see where opportunities are being won or lost.
Pie Chart – Sales Category Offers a clear representation of the sales distribution across products, services, subscriptions, and other categories, helping you easily identify the top sales drivers.
Heatmap – Stock Products Overview Helps monitor inventory and avoid stockouts or overstocks. A great way to visualize stock levels across product categories.
Map Visualization – Countries Performance Displays top-performing countries by revenue and user growth, giving businesses insight into regional performance trends and helping them target their marketing efforts.
🔥 Open for Exciting Projects: If this design aligns with your vision, I'd love to collaborate on your next big idea. Let’s create something extraordinary together! Reach out at obalanatosin16@gmail.com
❤️ Appreciate the design? Your likes and comments fuel my creativity! Don’t hesitate to share your thoughts below!


