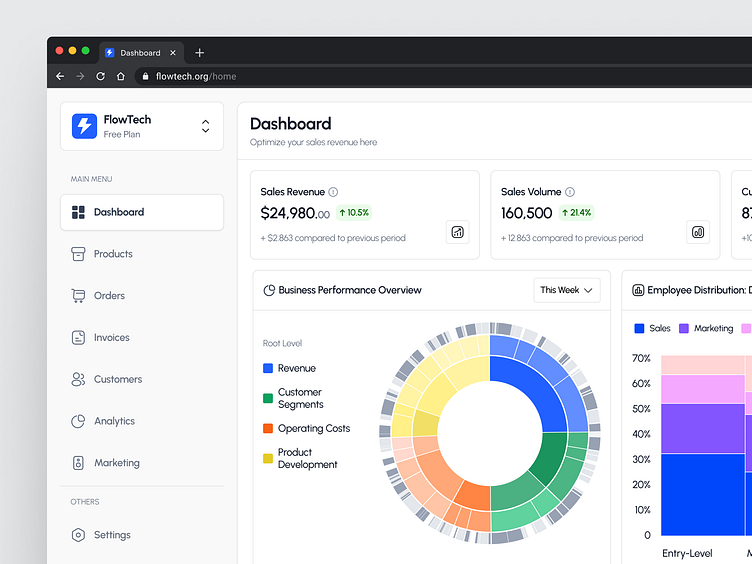
Sales Dashboard design
🚀 Dashboard Design – Sales Optimization & Performance Overview Key Features:
Sales Revenue Track and optimize your revenue with clear insights into sales volume, customer retention rate, and overall performance. Comparisons to previous periods make it easy to gauge progress.
Business Performance Overview A Sunburst Chart visually breaks down revenue, customer segments, operating costs, and product development. A perfect tool to see how each part of the business contributes to the overall performance.
Employee Distribution A Marimekko Chart gives a clear view of how employees are distributed across different departments and job levels.
Sales Funnel A Funnel Chart showing the sales process from leads to closed deals. Each stage of the sales process is represented to show conversion rates, helping optimize sales strategies.
Sales Category Breakdown A Pie Chart highlighting the distribution of sales between product sales, service sales, subscription sales, and other sales, making it easy to identify the top performers.
Stock Products Overview A Heatmap for visualizing stock levels across different product categories (e.g., electronics, clothing, food). This gives an at-a-glance view of where inventory is concentrated.
Countries Performance A Map visualization showing the top-performing countries by revenue, with clear insights into regional performance and user growth.
Set Your First Goal An empty state widget designed to encourage businesses to set their initial sales target, making it easier to start tracking progress and maximize revenue potential.
Full Dashboard
🔥 Open for Exciting Projects: If this design aligns with your vision, I'd love to collaborate on your next big idea. Let’s create something extraordinary together! Reach out at obalanatosin16@gmail.com
❤️ Appreciate the design? Your likes and comments fuel my creativity! Feel free to share your thoughts below!


