SaleMaster — Charts for Revenue Analytics 📊
Hello Friends 🌤️
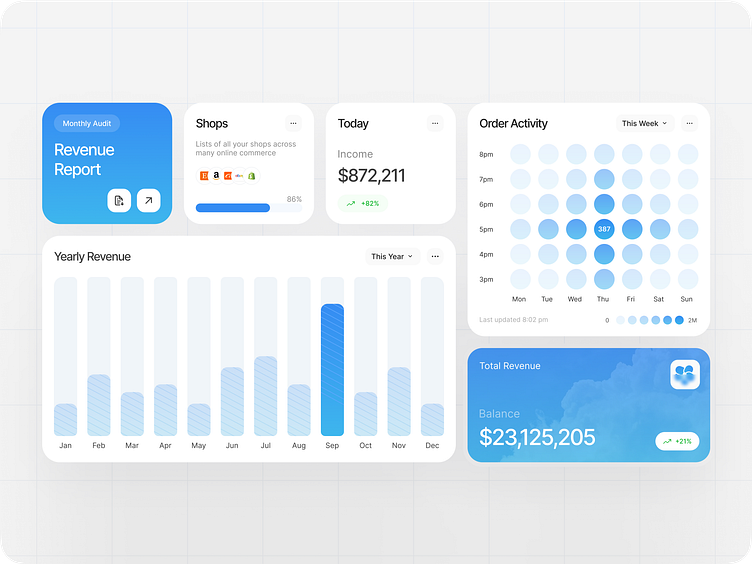
Meet some of the charts that were designed for revenue analytics. There are multiple variations to help illustrate data visualization from bar charts, progress bars, single values for numerical data such as income and balance, and heatmaps with a twist. On top of everything, you can download your revenue report as a PDF too.
Thanks for checking it out!
Have ideas to work on together?
Let's chat by dropping a line through:
syahra.aff@gmail.com
More by Syahra Affandi View profile
Like
