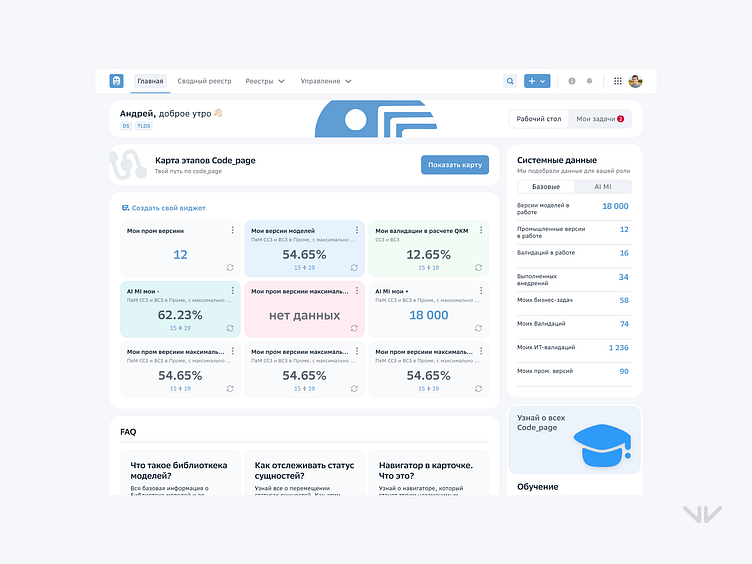
Dashboard — Data Analysis and Monitoring
This interface is an interactive dashboard that provides the user with a complete overview of their data and statistics within pipeline and model workflows.
Key features:
Personalized widgets: Users can create their own widgets to monitor key metrics such as model versions, production versions, validation performance, and other data.
System data: The right panel displays key information tailored to the user's role, including the number of models in work, completed validations, and business tasks.
Interactive visualization: Each data block is presented with percentage indicators and refresh options.
FAQ section: Frequently asked questions about platform functionality, such as tracking entity statuses and using the model library.
Learning section: A prompt for users to explore more about the Code_page platform through training materials.
---
Let's chat! hello@vonavivan.com
