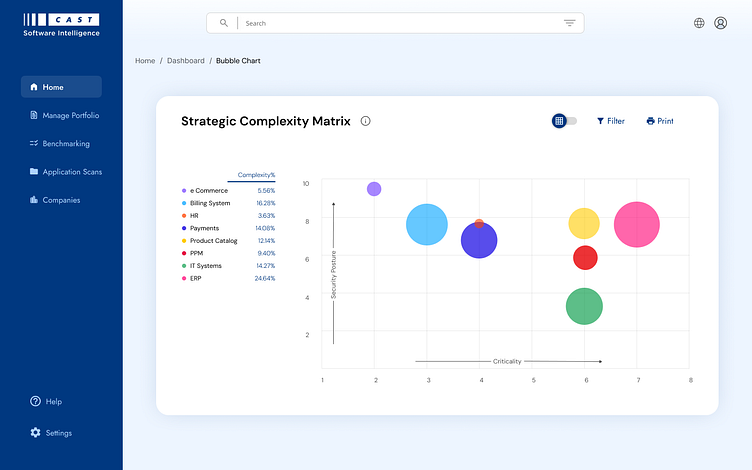
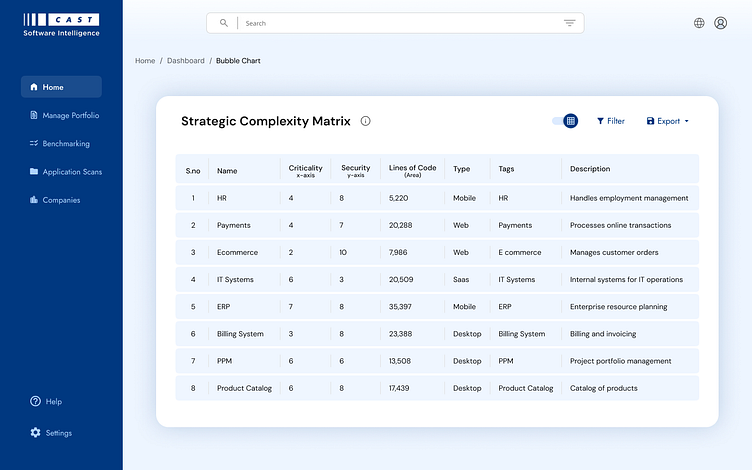
Bubble Chart Dashboard
Building the layout for a webapp. Bubble chart (a bubble is an application, x axis = criticality, y axis = more or less Secure, size of bubble = size of app based on lines of code (loc)).
Where the chart can switch to the table and can also be able to export as csv, pdf, excel etc.