Infographics
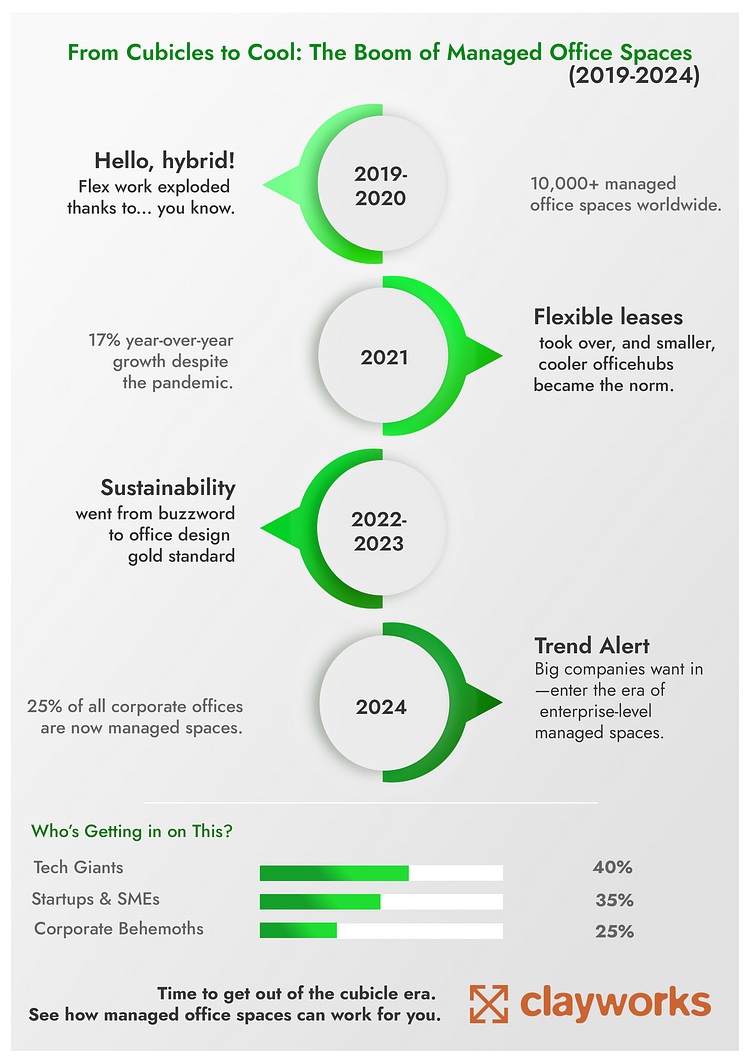
5 Years of Space Management: A Visual Journey of Growth and Efficiency"
The infographic creatively highlights the growth and management of spaces over the past five years, offering a visually engaging overview of key milestones and achievements. Using a timeline format, the design captures the expansion in square footage, client acquisitions, and occupancy rates with simple, clean graphics. Color-coded sections differentiate each year, making it easy to track progress at a glance. Key statistics are represented through icons and charts, such as pie charts for space utilization, bar graphs for annual growth, and map visuals for geographic expansion. The overall design is streamlined yet dynamic, allowing viewers to quickly grasp how efficiently spaces have been managed and scaled over time.
More by saiprabha View profile
Like
