UX Analysis & User Test Results
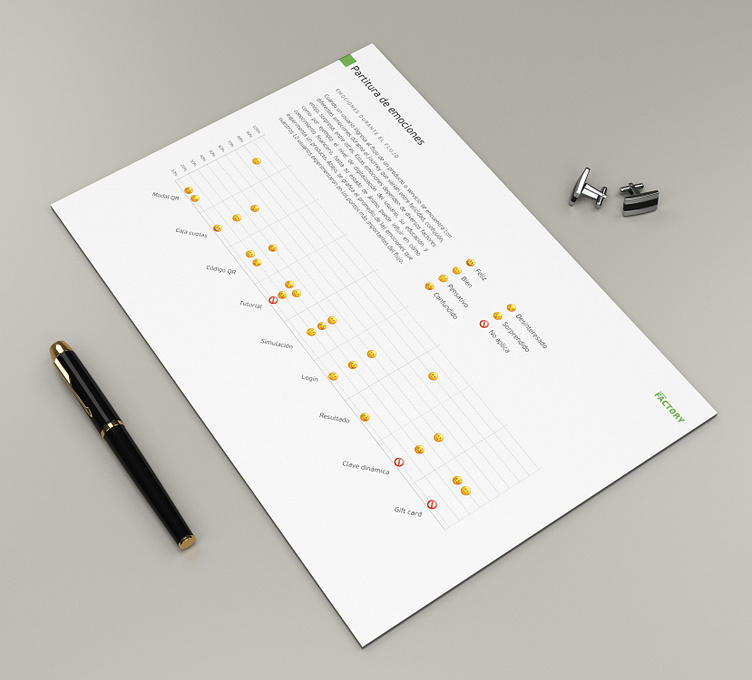
Effectively sharing user test results with stakeholders requires a clear and engaging visual presentation. In this example, I used a simple grid with emojis to represent users' emotions at each stage, providing an intuitive snapshot of their experience. Additionally, I incorporated a clean blue and purple curve chart to illustrate user interest levels throughout the product journey, making it easy to track engagement at different stages.
More by Paula View profile
Like

