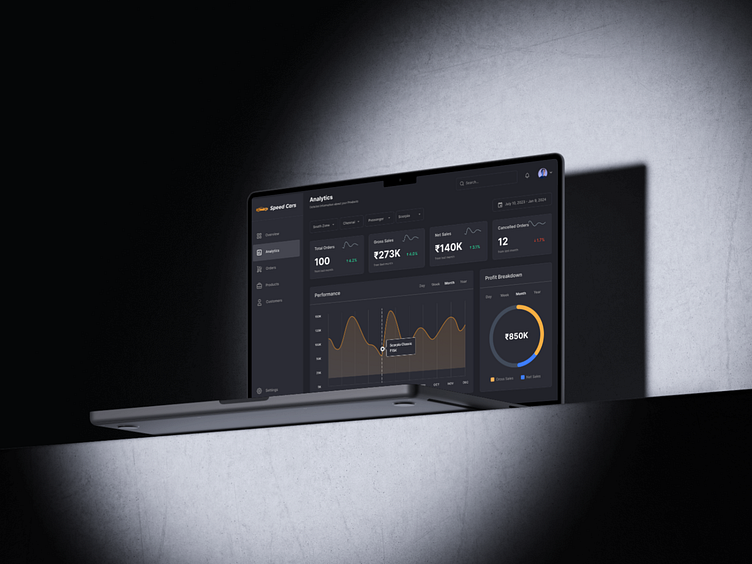
Elevate Your Insights with Stunning Data Visualization
contact@enspirit.co
Data is only as valuable as the insights you can derive from it, and effective data visualization is key to unlocking its full potential. Our cutting-edge visualization tool empowers you to transform complex datasets into clear, impactful visuals that tell a story.
From interactive dashboards to custom charts and graphs, our tool simplifies the process of creating visually compelling representations of your data. Whether you're analyzing trends, tracking KPIs, or presenting findings, our intuitive interface ensures that even non-technical users can build professional-grade visuals with ease.
Key features include customizable color schemes, real-time updates, and compatibility with various data sources, making it ideal for businesses, marketers, analysts, and designers. Visualizations can be easily shared across teams or exported for presentations, helping you communicate insights more effectively.
Data visualization is more than just charts; it’s about translating data into actionable insights. With our tool, you'll not only make your data easier to understand but also enhance decision-making and drive better outcomes
Visit our website: enspirit.co.

