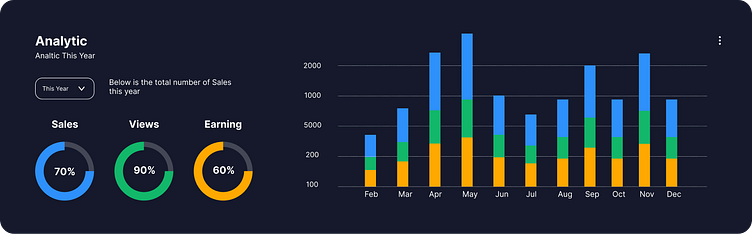
Analytics Chart 📊 Day 18 of My 100-Day Daily UI Challenge! 📊

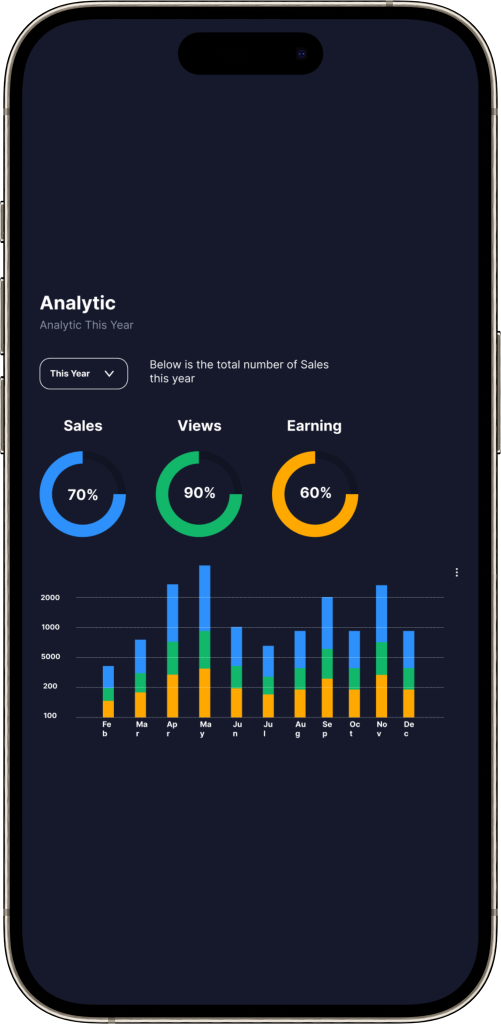
Today's focus is on data visualization! I designed an intuitive and responsive analytics chart for both mobile and desktop views. Whether you're on the go or at your desk, this chart ensures you have clear, actionable insights at your fingertips!
Design Highlights:
Responsive Layouts: Optimized for both mobile and desktop, ensuring a seamless experience across all devices.
Interactive Elements: Hover effects, tooltips, and smooth transitions for a more engaging user experience.
Clear Data Representation: Easy-to-read graphs and color-coded data points for instant analysis.
Curious to see how these charts can transform your data insights? Let’s dive into the numbers! 📈
Check out more of this design on Behance, and feel free to reach out if you need creative and impactful UI solutions!
#DailyUI #DesignChallenge #AnalyticsChart #ResponsiveDesign #DataVisualization #UIUXDesign #Day18