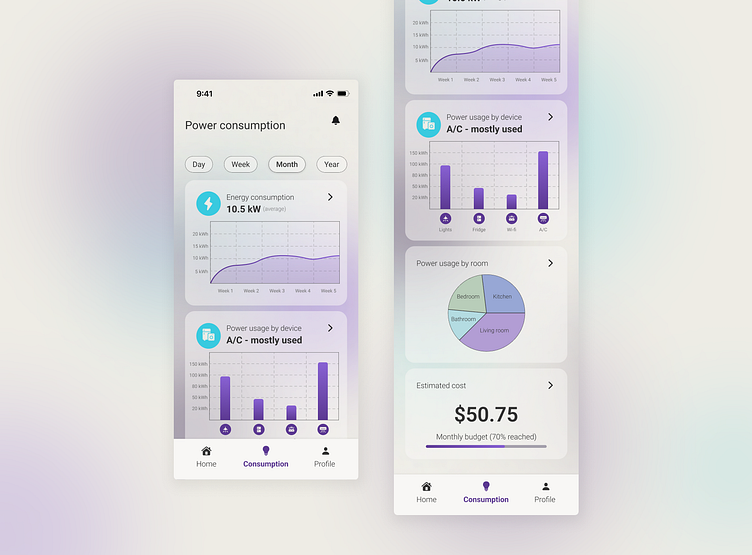
Daily UI Challenge #018
Hello, Dribbble!
It's Day #018 of the Daily UI Challenge! Today, I designed an analytics chart for the smart home app I created earlier. This dashboard provides a detailed breakdown of power consumption, offering insights into monthly usage, device- and room-specific consumption, and the cost of the used electricity. My goal was to create a visually clear and user-friendly interface that helps homeowners monitor and optimize their energy use. I'd love to hear your thoughts on the design! ⚡️📊
Contacts:
Email: elenatsoneva05@gmail.com
LinkedIn: https://www.linkedin.com/in/elena-tsoneva-b053362b8/
More by Elena Tsoneva View profile
Like


