Dashboard UI Design - Twintra | UIUX

Hello Dribbble !
How are you doing today? We hope You're doing well. 👍
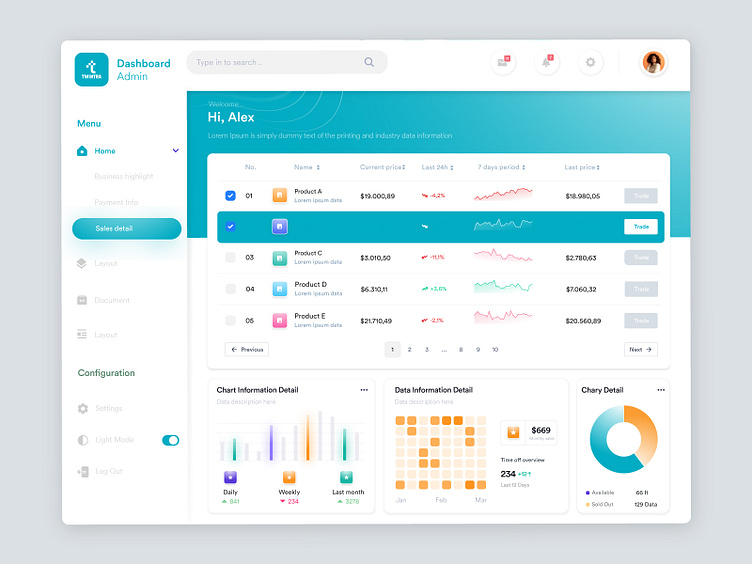
Explore our dynamic infographic dashboard for real-time metrics and actionable insights.
An infographic dashboard UI is a visual representation of data, typically designed to be interactive and easy to understand. It combines elements of infographics and dashboards to present complex information in a simplified, visually appealing way.It typically includes various graphical elements such as charts, graphs, tables, and widgets designed to summarize and analyze sales data in real-time or over a specific period.
Have a beautiful idea in mind?
Let's Collaborate!
Visit Us : 👇
Follow Us : 🔔
Instagram l Threads l LinkedIn l Facebook l Twitter l Pinterest l YouTube l TikTok