Elevating Data Analytics Concept Visualization via Illustration
At dbt Labs, I took on the challenge of creating a unified web experience and translating complex data concepts into visually appealing, accessible illustrations.
Challenge
dbt Labs needed a scalable design system to unify their extensive web presence and simplify complex data concepts for a broader audience. They needed an illustration system to ensure consistent use of visual imagery for specific concepts.
Solution
As Senior Web Designer, I spearheaded the development of a comprehensive web illustration system and created over 70 custom illustrations with direction from the Staff Brand Designer.
Process
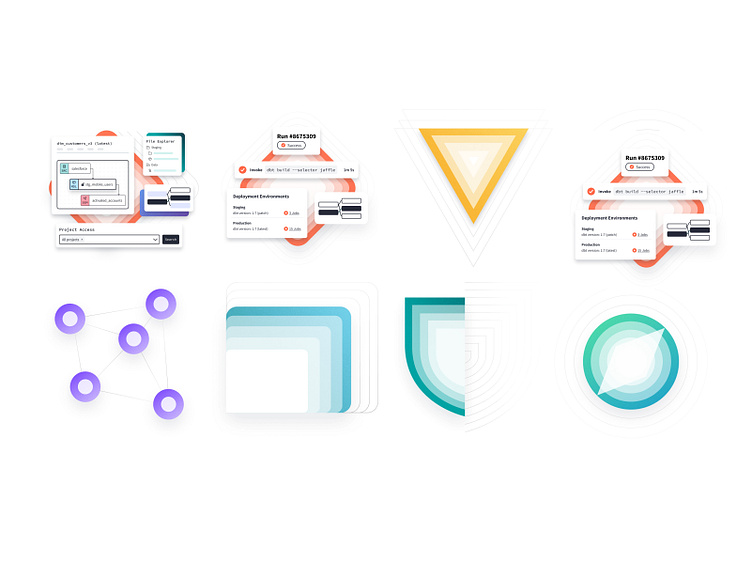
Illustration System Development
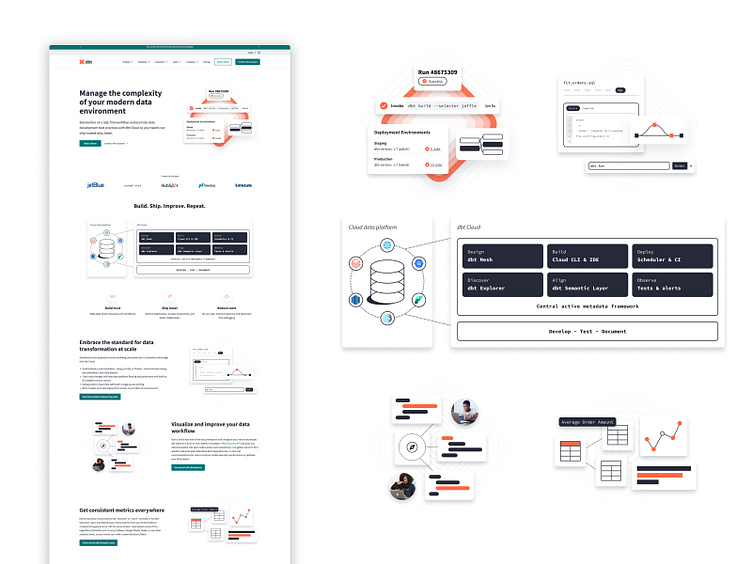
Created a cohesive user experience across 50+ pages, documentation site, and learning management system
Developed a robust pattern library, component specifications, and documentation based on atomic design theory - ensuring that every time an image is used that it demonstrates a specific concept
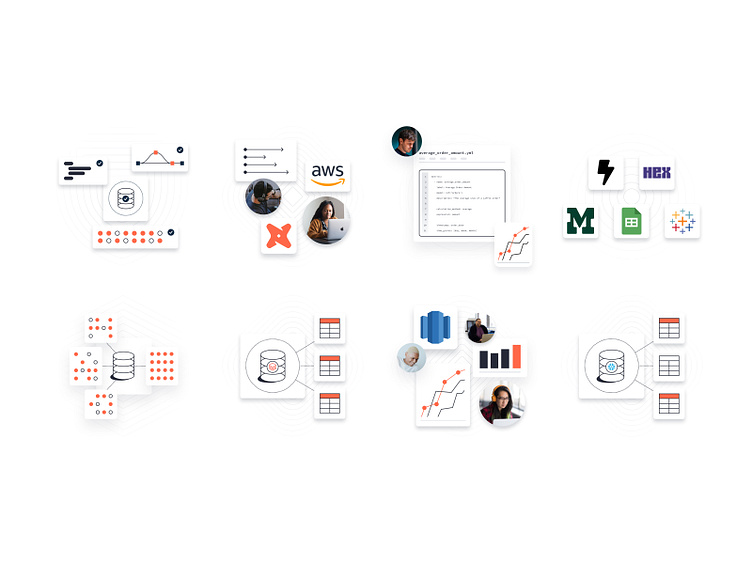
Custom Illustrations
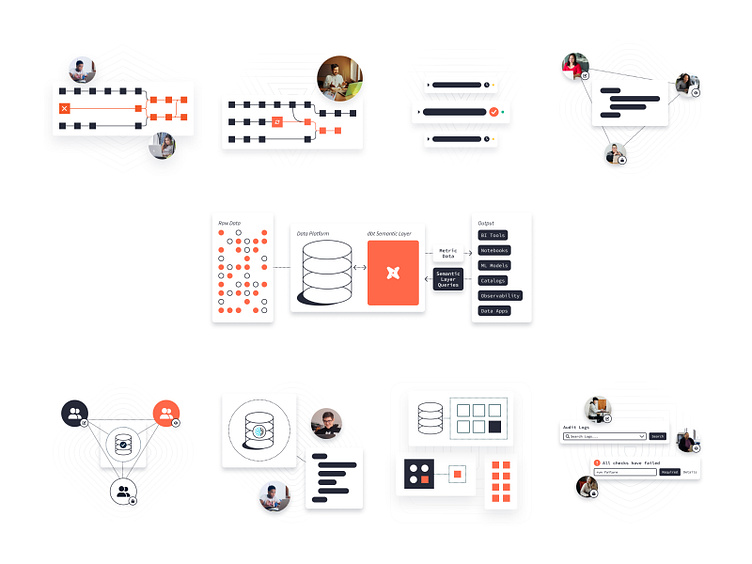
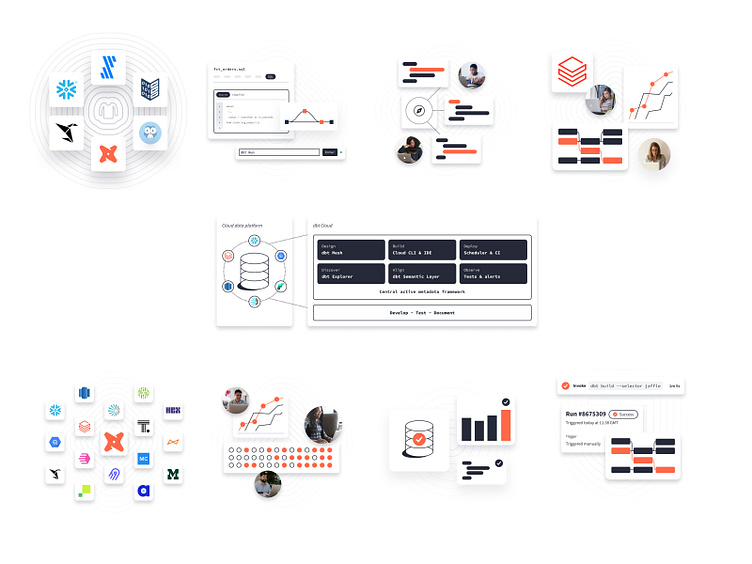
Crafted 70+ web illustrations enhancing visual engagement
Transformed complex, off-brand engineer-created graphs into clean, accessible visuals
Collaborated with Staff Brand Designer to establish a unique illustration style
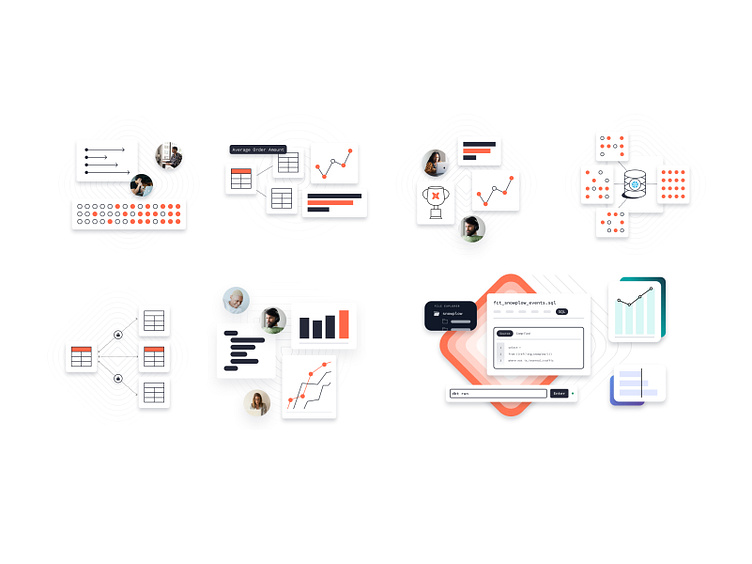
Data Visualization
Simplified complex data science concepts for non-technical audiences
Elevated brand imagery to industry-standard quality
Results
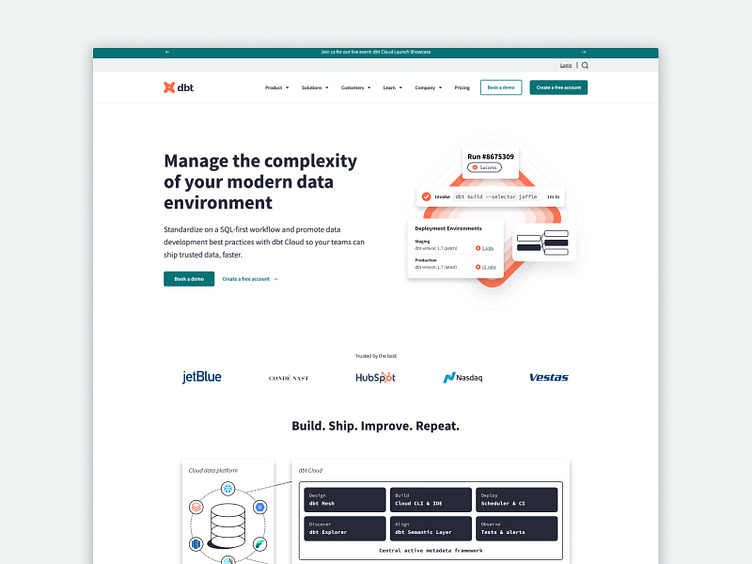
A cohesive, visually striking web presence that simplifies data concepts for users across technical and non-technical backgrounds.
See the transformation in the before and after shots!
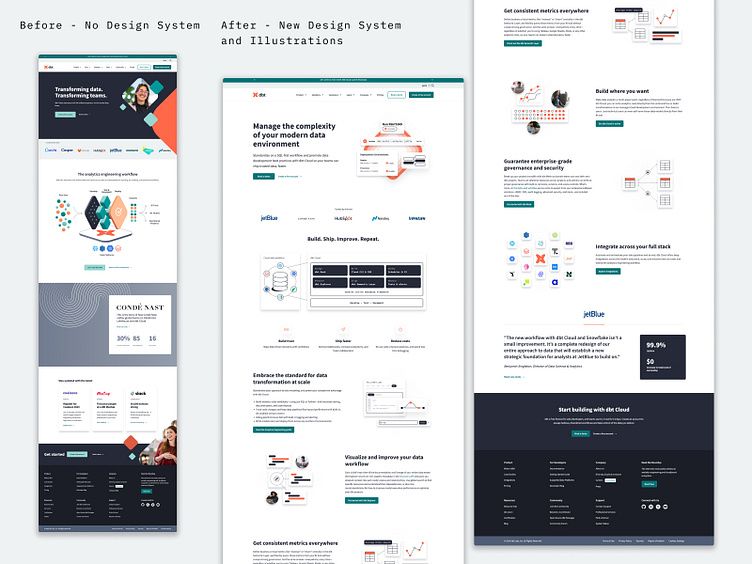
The new design system and illustrations significantly improved user experience, brand consistency, and content accessibility across dbt Labs' digital platforms.